Daily - Go to TTD's Tape of Stock Charts - Thursday. March 13, 2014
|
Daily - Go to TTD's Tape of Stock Charts - Thursday. March 13, 2014 |
|
Weekly - Bullish Conservative Investors - Go To TTD Long-Term Plays - Monday, March 10, 2013 |
|
Go to Video Show - "How to Make Money With Breakout Stocks" |
|---|

By Leo Fasciocco -- TTD
Ticker Tape Digest presents its daily stock market report containing stocks to go long as breakout trades, quick trades, or bargain trades. We also feature stocks under Significant Accumulation that are poised to breakout.
|
Ticker Tape Digest's Daily schedule guide for TTD subscribers 1. Pre-market - check Breakout Watch List and Quick Trades. 2. Morning - (11:30 - 12 A.M.) - check breakout stocks tape and breakout chart slide show. 3. Midday (1 P.M.) check TTD Midsession Report and see market video show. 4. After close (4 P.M.) check final TTD Report for day. Trading Strategies Bullish Aggressive Investors Bullish - "Breakout Stocks" - ideally suited for bull markets and special situation stocks. Potential for large returns. (See Performance) Aggressive Investor Bullish- "Quick Trade Stocks" -ideally suited for entry into top performing issues looking for a small quick profit." (See Performance) Conservative Investors "Bargain Buy Trades for the Long Term." Ideally suited for entry into top performing big cap stocks on pullbacks within overall up trend.(See Performance) Bearish Aggressive Bearish Investors - "Breakdown Stocks" to Sell Short. Ideally suited for bear markets or market pull backs. Potential for large returns (See Performance) |
|---|
The TTD report also contains stocks to short as breakdown plays and as bargain (swing trade) shorts.
Investors should tend to try to go with a strategy that fits with the stock market's trend, unless there is a special situation play.
TTD's Breakout Stocks - Long are most suitable for aggressive investors seeking ideal entry points into leading stocks, especially during bull markets. They can do extremely well in bull markets with gains of as much as several hundred percent.
These stocks can also do extremely well during strong market
rallies, or if they are in a industry group that is performing very well. They tend to have strong earnings outlooks and are near new-52 week, or all-time highs. 
TTD Quick Trade Stocks - Long These are leading issues that have pulled back in recent days, but could move higher soon. They are most suitable for Aggressive Investors willing to trade short term. These stocks will do extremely well during market advances. They have about 74% win rate. During market rally sequences the win rate is even higher. The return is small 3% to 8% in just a few days.
TTD's Bargain Buy Trades - Long - Long Term. These are for conservative bullish Investors These long-term buys are ideally suited for entry into stocks on pull backs within overall up trend. These stocks can give a good return long-term especially during a bull market.
TTD also presents Stocks To Sell or Sell Short. These issues are suitable for aggressive investors willing to take short positions both as trades or for longer-term plays. These stocks will do very well during bear markets or market pull backs.
TTD's Bearish breakdown stocks to sell short. These issues have potential to fall sharply. They often show a technical breakdown and also some fundamental business problem such as weak earnings.
TTD's multi-media updates include a slide-show that presents charts and analysis at midsession. Some times TTD presents feature analysis on stocks and the market. TTD uses Windows Media Files. (WMV).
TTD also presents a "Breakout Watch List" that is up dated daily. This list consists of key stocks in position to breakout. A close watch of this list can put you in the stock just as it breaks out. A good idea is to study the list and be ready to move into a stock quickly as it hits its breakpoint.
TTD often suggests using stop buy orders to enter. It is very important to buy a breakout stock as close as possible to the breakpoint. The idea is to get "elbow room" if the stock should follow through to the upside. This is very important in being successful in making big money with breakout stocks.
It is also essential to have a stop loss strategy for all stocks in which positions are taken. Not every stock will work as expected. It is important for investors to "police" their portfolios and avoid getting trapped in any bad positions.
Quality rating of breakout Two key factors: 1 - Stock near all-time in price or near a 52-week high. 2 - earnings growth current year is strong. The ideal play is a stock with an Above Average Quality Rating. The stock is near a new high and will have strong earnings. TTD's other ratings are Average and Below Average.
TTD also has special feature sections on Educational Tips on Investing.
To email Mr. Leo Fasciocco leo@tickertapedigest.com.For service, email Beverly Owen owen@tickertapedigest.com. TTD’s Tel: 1-480-926-1680.
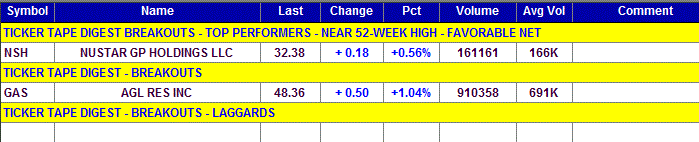
Breakout Stocks
Total Buy Breakouts so far today - 2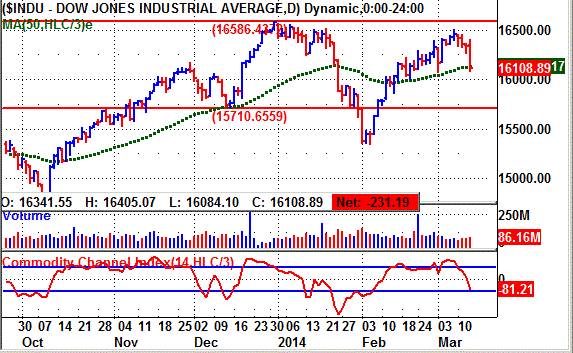
Overall Quality of Breakouts - ABOVE AVERAGE
Stocks Screened - 8,300
Bull side - Just 2 breakout stocks today. Stock market falls sharply and broadly. Trading range pattern exerts itself. Bulls be conservative and watchful.
(Put mouse on Dow chart to see Nasdaq chart)
Long Term Environment for bulls: Favorable
Stock Market Momentum
Market (Daily) - NYSE Bearish, Nasdaq Bearish
Market (Weekly) - NYSE Bullish, Nasdaq Bullish
Market (Monthly) - NYSE Bullish, Nasdaq Bullish
Ticker Tape Digest's
|
TTD's Quality Rating of Stock - NSH - ABOVE AVERAGE |
NSH, based in San Antonio, Tex., operates terminal petroleum liquid pipelines. Annual revenues: not available. NSH's stock breaks out from a six-week flat base today. The move comes despite a sharp drop in the stock market. So far today, NSH is trading 161,161 shares. Its average daily volume is 166,000 shares. 
NSH's stock rose modestly in the morning to clear its breakpoint (see 10-minute chart).
The stock peaked at 32.80 clearing its breakpoint near 32. The stock then trended sideways the rest of the day edging back just slightly late in the afternoon. 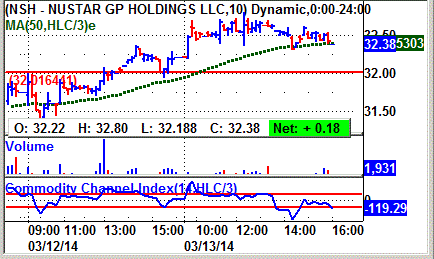
The stock was one of just two that broke out during the day as the stock market tumbled.
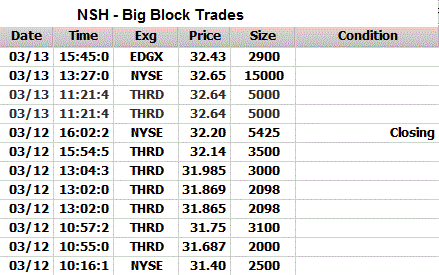
NSH's tape action shows the recent big block trades.
One can see the price for the blocks climbing from $31.40 in the prior session to as high as $32.65 on Thursday afternoon.
A key bullish block crossed the tape in the morning when 5,000 shares (duplicated) crossed the tape at $32.64.
That was up sharply from the prior block trade at $32.20.
NSH is a limited liability company that owns the two percent general partner interest, a 18.4 percent limited partner interest and the incentive distribution rights in NuStar Energy L.P.
The firm is one of the largest asphalt refiners and marketers and independent terminal and petroleum liquids pipeline operators in the nation.
It has operations in the United States, Netherlands Antilles, Canada, Mexico, the Netherlands and the United Kingdom
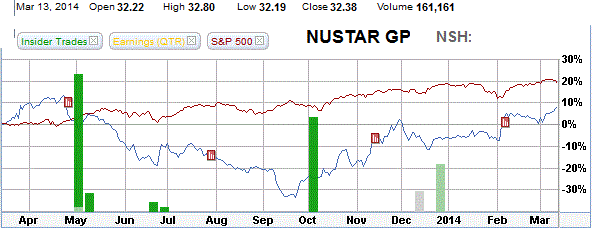
NSH's 12-month performance chart shows the stock appreciating just 9% versus a 20% gain for the S&P 500 index.
The chart does show a green bar back in October indicating heavy insider buying. They were right! The stock has moved higher since.
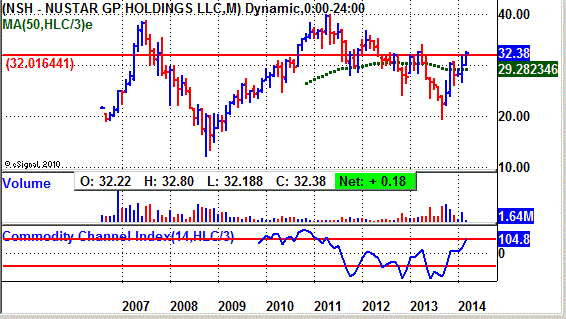
NSH's long-term chart shows the stock coming public back in late 2006 and trading around 22.
The stock advanced to a peak of $38.79 in 2007, the peak in the prior bull market.
The stock then fell back to 13 in 2008 due to the following bear market. It then staged another major recovery soaring back to 40 in 2011. It has since pulled back again, but now looks to make a turn up.
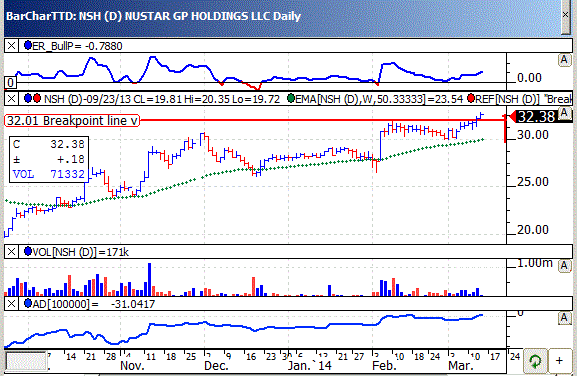
NSH's daily chart shows the stock advancing from 20 back in October to a peak near 32 by February.
The stock then put down a flat base above its rising 50-day moving average line.
The breakout today clears the base. However, the volume is just average. So, it will be important to see a follow up and a pickup in volume.
The stock's TTD momentum indicator (top of chart) is solidly bullish.
The accumulation - distribution line (bottom of chart) has broken out to the upside. That is good confirmation of solid buying supporting the stock
This year, analysts are forecasting a 44% surge in profits to $1.52 a share from $1.05 a year ago.
The stock sells with a price-earnings ratio of just 21.
Going out to 2015, the Street projects a 14% gain in net to $1.72 a share from the anticipated $1.52 for this year. 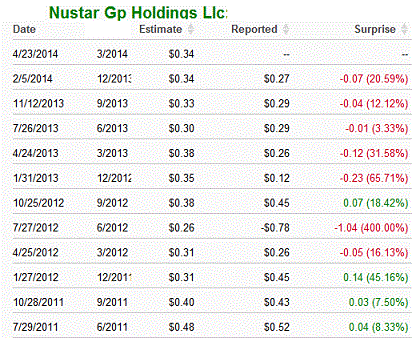
Net for the upcoming first quarter should leap 31% to 34 cents a share from the 26 cents a year ago.
The company has come up short the past several quarters. So, the stock should be watched carefully.
Net for the second quarter is projected to rise 23% to 36 cents a share from 29 cents the year before.
Strategy Opinion: TTD is targeting NSH for a move to 40 off this breakout.
A protective stop can be placed near 29. TTD rates NSH an average intermediate-term play with a lot depending on its earnings reports.
Sponsorship: Very Good. The largest fund holder is the 4-star rated Oppenheimer Steelpath MLP Select 40 Fund with a 3.9% stake. It was a recent buyer of 557,703 shares.
The second largest fund holder is the 4-star rated JPMorgan Value Advantage A Fund with a 1.1% stake.
NSH is 59% owned by institutions.
Insider Activity: Neutral. Not much activity. Currently, six analysts follow the stock, none have a buy, the same sentiment as three months ago.
Stock Performance Chart with Quarterly Earnings Markers.
| TTD's Breakout Profile
Rating Nustar Group Holdings LLC - (NSH) |
| TTD Check List | Bullish | Bearish | Neutral |
| Near 52-week High | YES | ||
| Volume | YES | ||
| Tick Volume | YES | ||
| Price Trend - Daily | YES | ||
| Price Trend - Long Term | YES | ||
| Price Daily Spread | YES | ||
| Base Structure | YES | ||
| Base - A-D | YES | ||
| Earnings-Quarterly | YES | ||
| Earnings-Long Term | YES | ||
| Earnings Outlook | YES | ||
| Industry Group | YES | ||
| Prior Breakout Success | YES | ||
| Fund Sponsorship | YES | ||
| Total Score | 10 | 0 | 4 |
Charts of Selected Breakout Stocks
| TTD's Quality Rating of Stock -GAS - AVERAGE |
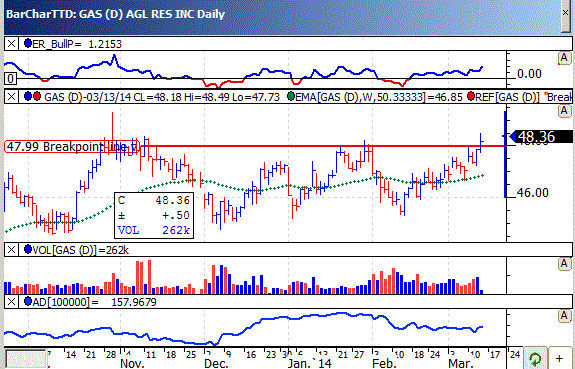

Ticker Tape Digest’s Daily List of “Stocks To Sell or Sell Short” ranks stocks well timed to be sold immediately based on daily trading. The list can be used as an alert to reduce current long-term positions.
Shorts from tape action so far today - 5
Stocks Screened - 8,300
Long-Term Environment for bears: Neutral.
Bear Side - Small list of shorts today, but some interesting plays. Bears can be venturesome.
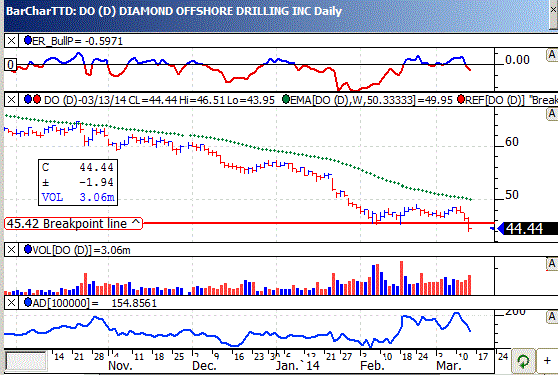
DO, based in Houston, Tex., provides contract drilling for offshore oil and gas wells. Annual revenues: $2.9 billion. DO's stock falls sharply today with heavy volume. The move cuts below key technical support. So far today, DO is trading 3.5 million shares. Its average daily volume is 2.3 million shares. 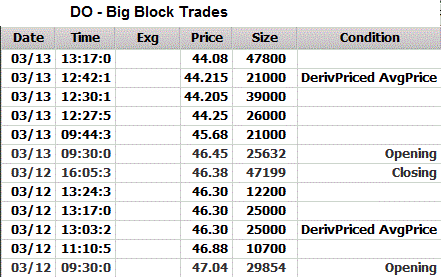
TTD highlighted DO as a short at our midsession video show on the Web Thursday.
DO' stock feel sharply in the morning. It hit an intraday low of 43.95 in the early afternoon.
The stock then lifted slightly and trended sideways in the afternoon.
DO's tape action shows the recent block trades.
One can see the price for the blocks falling from $47.04 in the prior session to as low as $44.08.
A key bearish trade came in the morning when a block of 21,000 shares crossed the tape at $45.68. That was down from the prior block at $46.45 on 25,632 shares.
DO is a deepwater drilling contractor and owns and operates one of the largest fleets of offshore drilling units in the world.
The company operates in the waters of six of the world's seven continents, supplying drilling services to the global energy industry.
Analysts are forecasting a 52% drop in DO's earnings for the first quarter and a 41% decline in the second quarter.
DO's daily chart shows the stock cutting below key technical support with expanding volume. The stock's TTD momentum indicator (top of chart) is now bearish.
Strategy Opinion: TTD is targeting DO for a decline to 37. A protective stop buy can be placed near 46.
| TTD's Quality Rating of Stock - DO - BELOW AVERAGE |
TTD columnist Leo Fasciocco has covered the stock market for over 20 years. His articles appear in many publications. He is also a speaker at the Intershow conferences. He has been on television and radio. He is author of many educational articles about stock investing and the book “Guide To High-Performance Investing.”

For information to subscribe to the Ticker Tape Digest Services call: B. J. Owen at 1-480-926-1680. Distributed by Corona Publishing Enterprises. Ticker Tape Digest Inc. P.O. Box 2044 Chandler, Az. 85244-2044. TTD “Professional Report” is available on the World Wide Web: $100 per month. Password needed. “TTD Professional“ Faxed is $200 per month. The TTD Daily Report is $39.95. Credit cards accepted.
(The information contained has been prepared from data deemed reliable but there is no guarantee of complete accuracy. Ticker Tape Digest Inc. is not affiliated with any broker, dealer or investment advisor. Nothing in this publication constitutes an offer, recommendation or solicitation to buy or sell any securities. Further research is advised. This report is copyrighted and no redistribution is permitted with out permission.)