Daily - Go to TTD's Tape of Stock Charts - Thursday, March 14
|
Daily - Go to TTD's Tape of Stock Charts - Thursday, March 14 |
|
Weekly - Bullish Conservative Investors - Go To TTD Long-Term Plays - Monday, March 4, 2013 |
|
Go to Video Show - "How to Make Money With Breakout Stocks" |
|---|

By Leo Fasciocco -- TTD
Ticker Tape Digest presents its daily stock market report containing stocks to go long as breakout trades, quick trades, or bargain trades. We also feature stocks under Significant Accumulation that are poised to breakout.
|
Ticker Tape Digest's Daily schedule guide for TTD subscribers 1. Pre-market - check Breakout Watch List and Quick Trades. 2. Morning - (11:30 - 12 A.M.) - check breakout stocks tape and breakout chart slide show. 3. Midday (1 P.M.) check TTD Midsession Report and see market video show. 4. After close (4 P.M.) check final TTD Report for day. Trading Strategies Bullish Aggressive Investors Bullish - "Breakout Stocks" - ideally suited for bull markets and special situation stocks. Potential for large returns. (See Performance) Aggressive Investor Bullish- "Quick Trade Stocks" -ideally suited for entry into top performing issues looking for a small quick profit." (See Performance) Conservative Investors "Bargain Buy Trades for the Long Term." Ideally suited for entry into top performing big cap stocks on pullbacks within overall up trend.(See Performance) Bearish Aggressive Bearish Investors - "Breakdown Stocks" to Sell Short. Ideally suited for bear markets or market pull backs. Potential for large returns (See Performance) |
|---|
The TTD report also contains stocks to short as breakdown plays and as bargain (swing trade) shorts.
Investors should tend to try to go with a strategy that fits with the stock market's trend, unless there is a special situation play.
TTD's Breakout Stocks - Long are
most suitable for aggressive investors seeking ideal entry points into leading stocks, especially during bull markets. They can do extremely well in bull markets with gains of as much as several hundred percent. 
These stocks can also do extremely well during strong market rallies, or if they are in a industry group that is performing very well. They tend to have strong earnings outlooks and are near new-52 week, or all-time highs.
TTD Quick Trade Stocks - Long These are leading issues that have pulled back in recent days, but could move higher soon. They are most suitable for Aggressive Investors willing to trade short term. These stocks will do extremely well during market advances. They have about 74% win rate. During market rally sequences the win rate is even higher. The return is small 3% to 8% in just a few days.
TTD's Bargain Buy Trades - Long - Long Term. These are for conservative bullish Investors These long-term buys are ideally suited for entry into stocks on pull backs within overall up trend. These stocks can give a good return long-term especially during a bull market.
TTD also presents Stocks To Sell or Sell Short. These issues are suitable for aggressive investors willing to take short positions both as trades or for longer-term plays. These stocks will do very well during bear markets or market pull backs.
TTD's Bearish breakdown stocks to sell short. These issues have potential to fall sharply. They often show a technical breakdown and also some fundamental business problem such as weak earnings.
TTD's multi-media updates include a slide-show that presents charts and analysis at midsession. Some times TTD presents feature analysis on stocks and the market. TTD uses Windows Media Files. (WMV).
TTD also presents a "Breakout Watch List" that is up dated daily. This list consists of key stocks in position to breakout. A close watch of this list can put you in the stock just as it breaks out. A good idea is to study the list and be ready to move into a stock quickly as it hits its breakpoint.
TTD often suggests using stop buy orders to enter. It is very important to buy a breakout stock as close as possible to the breakpoint. The idea is to get "elbow room" if the stock should follow through to the upside. This is very important in being successful in making big money with breakout stocks.
It is also essential to have a stop loss strategy for all stocks in which positions are taken. Not every stock will work as expected. It is important for investors to "police" their portfolios and avoid getting trapped in any bad positions.
Quality rating of breakout Two key factors: 1 - Stock near all-time in price or near a 52-week high. 2 - earnings growth current year is strong. The ideal play is a stock with an Above Average Quality Rating. The stock is near a new high and will have strong earnings. TTD's other ratings are Average and Below Average.
TTD also has special feature sections on Educational Tips on Investing.
To email Mr. Leo Fasciocco leo@tickertapedigest.com.For service, email Beverly Owen owen@tickertapedigest.com. TTD’s Tel: 1-480-926-1680.
Breakout Stocks
Total Buy Breakouts so far today - 16
Overall Quality of Breakouts - Below Average
Stocks Screened - 8,300
Bull side - Breakout list large, but very selective. Bulls be conservative. Stock market holds up trend.
(Put mouse on Dow chart to see Nasdaq chart)
Long Term Environment for bulls: Favorable
Market (Daily) - NYSE Bullish, Nasdaq Bullish
Market (Weekly) - NYSE Bullish, Nasdaq Bullish
Market (Monthly) - NYSE Bullish, Nasdaq Bullish
Ticker Tape Digest's
(See Top Performing Breakout Stocks for 2011- 2012)
|
TTD's Quality Rating of Stock - NBL - AVERAGE |
NBL, based in Houston, produces oil products. Annual revenues: $4.2 billion. NBL's stock breaks out today from a six-week flat base. The move carries the stock to a new all-time high. So far today, NBL is trading 1 million shares. Its average daily volume is 1.1 million shares. 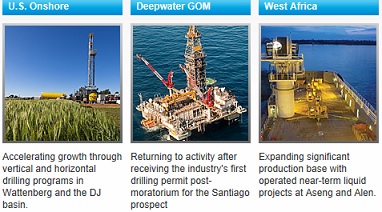
The stock started to push higher in the middle of the morning. That is when it cut across its breakpoint line (see 10-minute chart).
In the afternoon, the stock continued to work higher.
There was some heavy volume that hit the tape late in the day.
TTD's clip of the tape shows the action 
One can see there were two key bullish trades.
The first was a block of 110,718 shares crossing at $115.98.
Then a second on 30,000 shares, also at $115.98.
The tape showed the blocks came on a sequence triggered by an up tick from the prior trade - not a block - at $115.96.
That was not a big up tick, but enough to show that some institutions were willing to step up an buy at a slightly higher price. 
NBL is the parent company of Samedan Oil Corporation, Noble Gas Marketing, Inc. and Noble Trading, Inc.
NBL is one of the nation's leading independent energy companies.
The company operates throughout major basins in the United Stated including the Gulf of Mexico, as well as internationally, in Argentina, China, Ecuador, Equatorial Guinea, the Mediterranean Sea, the North Sea and Vietnam.
NBL's 12-month performance chart shows the stock appreciating 18% versus an 11% rise for the S&P 500 index.
One can see heavy insider selling in December. That was then followed by strong insider buying this year around the time of the earnings report.
NBL's long-term chart shows the stock climbing from 19 back in 2003 to a peak of 105 in early 2008. However, the bear market set in and the stock took a tumble back down to 30.
However, it has since made a big come back. The push to a new high could draw in more buying on Friday from the new high crowd. 
NBL's daily chart shows the stock advancing from 90 back in October to a peak near 115 by February.
The base set up is above a rising 50-day moving average line. That shows the stock is in an up trend.
The TTD momentum indicator (top of chart) is strongly bullish.
The accumulation - distribution line (bottom of chart) broke out before the price of the stock. That is a bullish omen.
This year, analysts are forecasting a 28% jump in NBL's earnings to $6.36 a share from $4.95 a year ago. The stock sells with a price-earnings ratio of 18. TTD sees that as attractive to value investors. That is because the p/e is well below the earnings growth rate.
Going out to 2014, profits should climb another 28% to $8.14 a share from the anticipated $6.36 this year.
Net for the upcoming first quarter, however, is expected to decline 31% to $1.21 a share from $1.75 the year before. However, at times NBL has topped the consensus estimate by a wide margin. In the prior quarter, it surpassed the Street projection by 58 cents a share, or 54%. So, surprises can happen.  (see table)
Looking out to the second quarter, net should leap 86% to $1.43 a share from 77 cents a year ago,
Strategy Opinion: NBL has all the numbers to send the stock higher. TTD is targeting NBL for a push to 135. A protective stop can be placed near 110.
TTD rates NBL a good intermediate-term play. There is also a chance for a stock split which could spice up the stock.
Sponsorship: Very Good. The largest fund holder is 4-star rated Fidelity Contrafund with a massive 9.8% stake. It has held its position of 17.5 million shares steady.
A key buyer recently was 3-star rated American Funds Fundamental Investors which purchased 1.5 million shares. It has 1.7% stake.
NBL has 178.7 million shares outstanding. Institutions hold 94% of the stock.
Insider Activity: Bullish. Insiders have been granted options at $109 a share recently. They have done no selling. That is a very bullish pattern meaning that they will do everything to push the stock higher. TTD also sees chances for a stock split.
Currently, 22 analysts follow the stock, 13 have a buy, down from 16 three months ago.
Stock Performance Chart with Quarterly Earnings Markers.
| TTD's Breakout Profile
Rating Noble Energy Inc. - (NBL) |
| TTD Check List | Bullish | Bearish | Neutral |
| Near 52-week High | YES | ||
| Volume | YES | ||
| Tick Volume | YES | ||
| Price Trend - Daily | YES | ||
| Price Trend - Long Term | YES | ||
| Price Daily Spread | YES | ||
| Base Structure | YES | ||
| Base - A-D | YES | ||
| Earnings-Quarterly | YES | ||
| Earnings-Long Term | YES | ||
| Earnings Outlook | YES | ||
| Industry Group | YES | ||
| Prior Breakout Success | YES | ||
| Fund Sponsorship | YES | ||
| Total Score | 13 | 1 | 0 |
Charts of Selected Breakout Stocks
| TTD's Quality Rating of Stock - CVLT - AVERAGE |
| TTD's Quality Rating of Stock - CGI - AVERAGE |
| TTD's Quality Rating of Stock - HXL - AVERAGE |

Ticker Tape Digest’s Daily List of “Stocks To Sell or Sell Short” ranks stocks well timed to be sold immediately based on daily trading. The list can be used as an alert to reduce current long-term positions.
Shorts from tape action so far today - 2
Stocks Screened - 8,300
Long-Term Environment for bears: Unfavorable.
Bear Side - Only a few short plays. Stock market remains in up trend. Bears remain conservative.
FFIV, based in Seattle, provides internet traffic services for servers. Annual revenues: $1.4 billion. FFIV's stock breaks below key technical support today with a pickup in volume. So far today, FFIV is trading 1.8 million shares. Its average daily volume is 1.5 million shares. TTD sees more on the downside. 
FFIV's stock moved lower today to extended the decline of the prior two sessions. The stock hit an intraday low of 91.07 around midday. In the afternoon, it trended sideways.
FFIV's tape action reveals heavy institutional selling pressure.
The key bearish block trade came on Wednesday when 163,181 shares (duplicated) crossed the tape. That was down sharply from the prior block trade at $94.47 the day before.
Also, today the tape action has been very bearish.
A bearish block crossed in the morning of 97,100 shares at $91.92. That was down from the prior block at $92.79.
FFIV provides integrated Internet traffic and content management solutions designed to improve the availability and performance of internet-based servers and applications.
The company's products monitor and manage local and geographically dispersed servers and intelligently direct traffic to the server best able to handle a user's request.
The products are designed to help prevent system failure and provide timely responses to user requests and data flow.
This year, analysts are forecasting a 17% rise in net to $4.09 a share from $3.50 a year ago. The stock sells with a price-earnings ratio of 22.
Technically, FFIV is breaking down from a head-and-shoulder topping pattern. The stock's accumulation - distribution line (bottom of chart) is in a sharp down trend. That shows heavy and subtle selling pressure.
Strategy Opinion: TTD is targeting FFIV for a decline to 82 within the next few months, or sooner. A protective stop buy can be placed near 93.
| TTD's Quality Rating of Stock - FFIV - AVERAGE |
TTD columnist Leo Fasciocco has covered the stock market for over 20 years. His articles appear in many publications. He is also a speaker at the Intershow conferences. He has been on television and radio. He is author of many educational articles about stock investing and the book “Guide To High-Performance Investing.”

For information to subscribe to the Ticker Tape Digest Services call: B. J. Owen at 1-480-926-1680. Distributed by Corona Publishing Enterprises. Ticker Tape Digest Inc. P.O. Box 2044 Chandler, Az. 85244-2044. TTD “Professional Report” is available on the World Wide Web: $100 per month. Password needed. “TTD Professional“ Faxed is $200 per month. The TTD Daily Report is $39.95. Credit cards accepted.
(The information contained has been prepared from data deemed reliable but there is no guarantee of complete accuracy. Ticker Tape Digest Inc. is not affiliated with any broker, dealer or investment advisor. Nothing in this publication constitutes an offer, recommendation or solicitation to buy or sell any securities. Further research is advised. This report is copyrighted and no redistribution is permitted with out permission.)