![]()
|
|
|
Go to Video Show - "How to Make Money With Breakout Stocks |
|---|

By Leo Fasciocco -- TTD
Ticker Tape Digest presents its daily stock market report containing stocks to go long as Breakout Trades, Quick Trades, or Bargain Accumulation Trades.
We also feature stocks under Significant Accumulation that are poised to breakout.
|
Ticker Tape Digest's Daily schedule guide for TTD subscribers 1. Pre-market - check Breakout Watch List and Quick Trades. 2. Morning - (11:30 - 12 A.M.) - check breakout stocks tape and breakout chart slide show. 3. Midday (1 P.M.) check TTD Midsession Report and see market video show. 4. After close (4 P.M.) check final TTD Report for day. Trading Strategies Bullish Aggressive Investors Bullish - "Breakout Stocks" - ideally suited for bull markets and special situation stocks. Potential for large returns. (See Performance) Aggressive Investor Bullish- "Quick Trade Stocks" -ideally suited for entry into top performing issues looking for a small quick profit." (See Performance) Conservative Investors "Bargain Buy Trades for the Long Term." Ideally suited for entry into top performing big cap stocks on pullbacks within overall up trend.(See Performance) Bearish Aggressive Bearish Investors - "Breakdown Stocks" to Sell Short. Ideally suited for bear markets or market pull backs. Potential for large returns (See Performance) |
|---|
The TTD report also contains stocks to short as breakdown plays and as bargain (swing trade) shorts.
Investors should tend to try to go with a strategy that fits with the stock market's trend, unless there is a special situation play.
TTD's Breakout Stocks - Long are
most suitable for aggressive investors seeking ideal entry points into leading stocks, especially during bull markets. They can do extremely well in bull markets with gains of as much as several hundred percent. 
These stocks can also do extremely well during strong market rallies, or if they are in a industry group that is performing very well. They tend to have strong earnings outlooks and are near new-52 week, or all-time highs.
TTD Quick Trade Stocks - Long These are leading issues that have pulled back in recent days, but could move higher soon. They are most suitable for Aggressive Investors willing to trade short term. These stocks will do extremely well during market advances. They have about 74% win rate. During market rally sequences the win rate is even higher. The return is small 3% to 8% in just a few days.
TTD also presents Stocks To Sell or Sell Short. These issues are suitable for aggressive investors willing to take short positions both as trades or for longer-term plays. These stocks will do very well during bear markets or market pull backs.
TTD's Bearish breakdown stocks to sell short. These issues have potential to fall sharply. They often show a technical breakdown and also some fundamental business problem such as weak earnings.
TTD's multi-media updates include a slide-show that presents charts and analysis at midsession. Some times TTD presents feature analysis on stocks and the market. TTD uses Windows Media Files. (WMV).
TTD also presents a "Breakout Watch List" that is up dated daily. This list consists of key stocks in position to breakout. A close watch of this list can put you in the stock just as it breaks out. A good idea is to study the list and be ready to move into a stock quickly as it hits its breakpoint.
TTD often suggests using stop buy orders to enter. It is very important to buy a breakout stock as close as possible to the breakpoint. The idea is to get "elbow room" if the stock should follow through to the upside. This is very important in being successful in making big money with breakout stocks.
It is also essential to have a stop loss strategy for all stocks in which positions are taken. Not every stock will work as expected. It is important for investors to "police" their portfolios and avoid getting trapped in any bad positions.
Quality rating of breakout Two key factors: 1 - Stock near all-time high in price or near a 52-week high. 2 - earnings growth current year is strong. The ideal play is a stock with an Above Average Quality Rating. The stock is near a new high and will have strong earnings. TTD's other ratings are Average and Below Average.
TTD also has special feature sections on Educational Tips on Investing.
To email Mr. Leo Fasciocco leo@tickertapedigest.com.
For service, email Beverly Owen owen@tickertapedigest.com. TTDÆs Tel: 1-480-878-8381 or 480-704-3331.
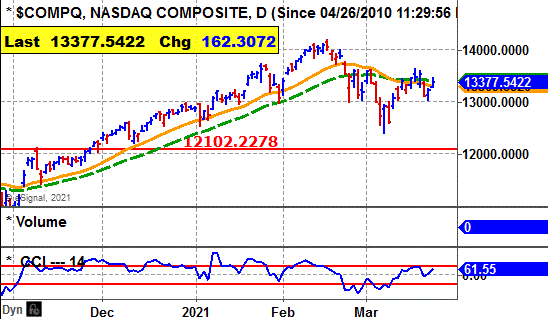
Monday - March 22, 2021
TTD's Breakout Stocks
Stock Market Overview
Total Buy Breakouts - 7
Quality of Breakouts - Average.
Stocks Screened - 12,234
Bull side - Small list of breakouts but some interesting plays.
Stock market - Major averages are bullish in all time sectors.
Comment - Small list of breakouts but some good looking plays for aggressive bulls.
See Latest Earnings Reports - A company that tops the Street's highest earnings estimate has potential to go higher. Key earnings beats - DSP and SNX.
Stock Market Momentum
(Daily is based on a moving average)
|
Market (Daily) |
Market (Weekly) |
Market (Monthly) |
|
Dow - Bullish |
Dow - Bullish |
Dow - Bullish |
|
Nasdaq - Bullish |
Nasdaq - Bullish |
Nasdaq - Bullish |
|
S&P 500 - Bullish |
S&P 500 - Bullish |
S&P 500 - Bullish |


 Ticker Tape Digest's
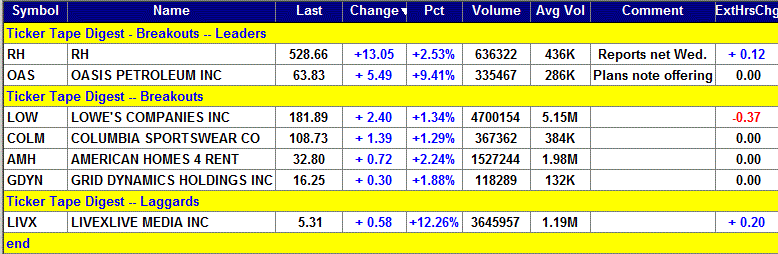
|
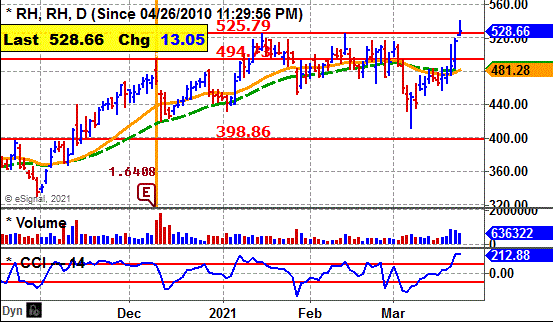
TTD's Quality Rating of Stock - RH - ABOVE AVERAGE |
RH, based in Corte Madera, Ca., sells home furnishings. Annual revenues: $2.6 billion. RH's stock moves higher Monday and breaks out from its 11-week, flat base. 
The move carries the stock to a new all-time. That is bullish.
TTD highlighted RH as a breakout a our midsession video show on the web Monday.
TTD sees potential for more on the upside. RH is a leader.
RH's stock cleared its breakpoint in the morning.
The stock worked higher in the afternoon and reached an intraday high of 540.49.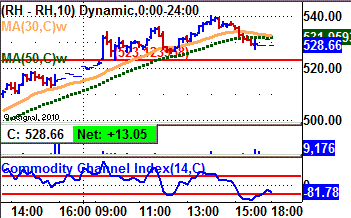
The stock backed off a bit late in the day, but held above the breakpoint.
In after-hours trading, RH was up 12 cents a share.
Tape Action
RH's tape action shows the recent block trades.
One can see the price for the blocks climbing from $515.61 in the prior session to as high as $539.50 in the afternoon.
A key bullish trade came at the opening when a block of 8,498 shares (duplicated) crossed the tape at $523.58.
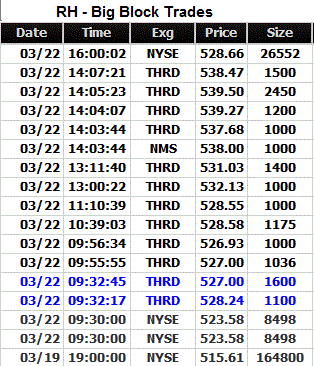 That was up from the prior block the prior session at $515.61 on 164,800 shares.
Near the close a block of 26,552 shares (duplicated) crossed at $528.66.
That was down from the prior trade at $529.37 on 100 shares.
Business
RH, formerly Restoration Hardware Holdings, Inc., is a retailer in the home furnishings marketplace.
The company sells furniture, lighting, textiles, bathware, decor, outdoor and garden, tableware, and child and teen furnishings.
RH's non-furniture category includes lighting, textiles, fittings, fixtures, surfaces, accessories and home decor.
The company also owns a controlling interest in Design Investors WW Acquisition Company, LLC, which owns the business operating under the name 'Waterworks'.
Charts
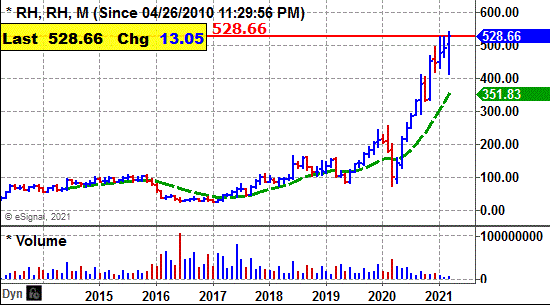
RH's 12-month performance chart shows the stock up 550% versus a 60% gain for the stock market.
Insiders were buyers using stock options. The price was not disclosed.
They have not done any selling.
 RH's long-term chart shows the stock breaking out back in 2018 at $100. The stock advanced to a peak at $256 in early 2020.
The stock fell back to $73 in early 2020 when the stock market took a dive.
The stock then turned and has since rallied strongly to a new all-time high of $540 Monday.
RH's daily chart shows the stock in a flat base with two shakeouts to the downside.
The breakout clears the base with a modest volume.
Earnings Outlook
Net for the fiscal year ending in January of this year should surge 51% to $17.55 a share from the $11.66 the prior year.
The stock has a price-earnings ratio of 30.
Looking out to fiscal 2022 ending in January the Street predicts a 9% increase in net to $19.16 a share from the anticipated $17.55 for fiscal 2021.
Quarterly earnings will be strong.
Net for the fiscal fourth quarter ended in January the Street predicts a 28% leap in net to $4.76 a share from the $3.72 the prior year.
Then in the fiscal first quarter analysts predict a big 120% spurt in net to $2.80 a share from the $1.27 the prior year.
The company beat the Street estimate the past four quarters by 78 cents a share, $1.46, 47 cents and 13 cents.
Strategy Opinion: TTD is targeting RH for a move to $590 within the next few months, or sooner.
A protective stop can be placed near $515.
Intermediate-Term Rating: Average.
Suitability: Average Bulls.
TTD's special research of Stock's Prior Performance:
|
Breakout Success |
Bullish |
RH scored big gains off recent breakouts. |
|
Response to Net |
Bullish |
RH rose 9 times after 12 earnings reports. |
|
Seasonal Success |
Bullish |
RH avg. loss % in March, gain 12.7% in April prior years. |
|
Earnings Beats |
Bullish |
RH beat Street net estimate 16 times after 19 reports. |
Stock's Prior Performance After A Breakout
|
Stock's % Change from Breakout to peak - prior to cut below 50-day M/A. |
Date of Breakout |
Break point Price |
Stocks Price Peak after Breakout - prior to cut below 50-day M/A |
Date Trade Closed |
|
27% |
11/13/2020 | 404.31 | 515.57 | 1/14/2021 |
|
44% |
7/15/2020 | 267.29 | 385.46 | 9/10/2020 |
|
23% |
11/21/2019 | 195.08 | 241.97 | 12/6/2019 |
|
27% |
9/5/2019 | 144.93 | 185.17 | 10/24/2019 |
|
47% |
6/5/2018 | 105.54 | 155 | 6/12/2018 |
(In actual trading, entry and exit points could vary depending on broker execution.
Also, ideal are breakouts to a new 52-week high or better, perhaps all-time highs.)
Stock's Long-term Chart
Stock's Price Performance after Reporting Earnings
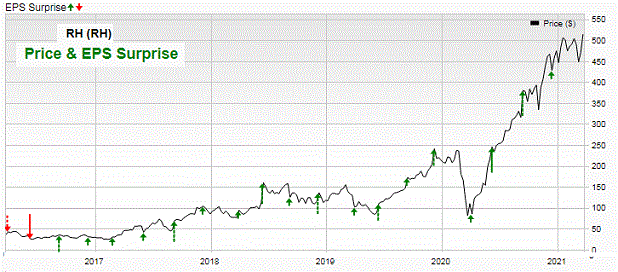
Stock's Performance Chart with Quarterly Earnings Markers vs. S&P 500
Insider Buying in Green - Insider Selling in Red

Charts of Selected Breakout Stocks
|
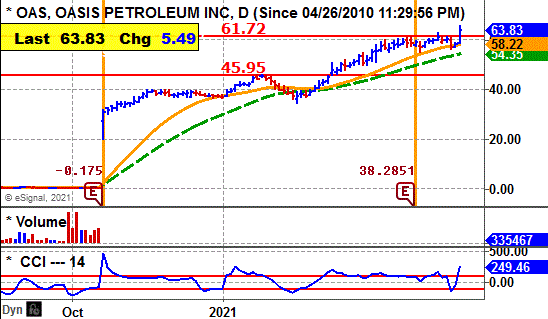
TTD's Quality Rating of Stock - OAS - ABOVE AVERAGE |
|
TTD's Quality Rating of Stock - LOW - AVERAGE |

|
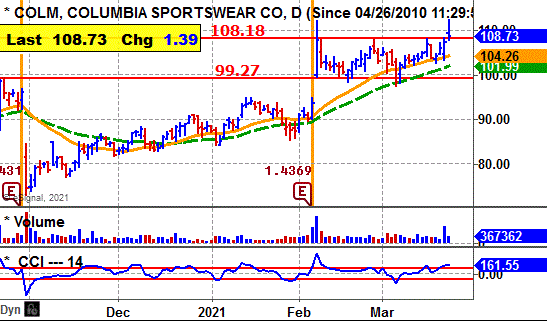
TTD's Quality Rating of Stock - COLM - AVERAGE |
|
TTD's Quality Rating of Stock - AMH - ABOVE AVERAGE |


Ticker Tape DigestÆs Daily List of ōStocks To Sell or Sell Shortö ranks stocks well timed to be sold immediately based on daily trading. The list can be used as an alert to reduce current long-term positions.
Shorts from tape action - 2
Stocks Screened - 12,234
Long-Term Environment for bears: Unfavorable.
Bear Side - Small list of shorts. Bears be conservative.

KC, based in China, provides cloud services. Annual revenues: $897 million. KC's stock breaks down Monday from a head-and-shoulder pattern Monday. 
So far today, KC is trading 1.8 million shares. Its average daily volume is 2.1 million shares.
TTD sees potential for more on the downside.
KC's stock cut below support in the morning and declined to around $46.
The stock then trended mostly sideways the rest of the day.
In after-hours trading, KC was down 27 cents a share. 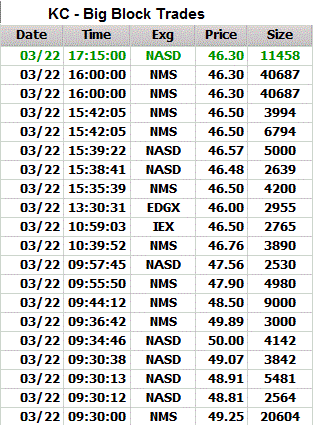
Tape Action
KC's tape action shows the recent block trades.
One can see the price for the blocks falling from $50 in the morning to as low as $46 in the early afternoon.
A key bearish trade came in the morning when a block of 3,000 shares crossed the tape at $49.89.
That was down from the prior block at $50 on 4,142 shares.
Near the close a big block of 40,687 shares (duplicated) crossed a $46.30.
That was down from the prior block at $46.50 on 3,994 shares.
Business
KC builds cloud platform consisting of cloud infrastructure, cloud products and industry-specific solutions.
The company mainly conducts its businesses in China.
Earnings:
This year, analysts forecast a loss of 35 cents a share compared with a loss of 76 cents the prior year.
There was no quarterly estimates available.
Looking out to 2022, the Street predicts a profit of 33 cents a share.
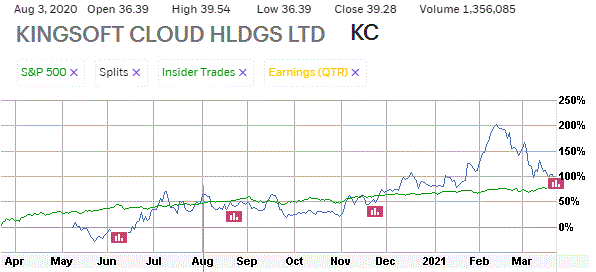
Charts:
KC's daily chart shows the stock cutting below key support from a classic head and shoulder pattern.
Since February, KC has been working lower from a peak at $74 down to $46.
Strategy Opinion: TTD is targeting KC for a decline to $38 within the next few months, or sooner. A protective stop buy can be placed near $51.
Suitability: Aggressive Bears.
TTD's Stock Probability research of Prior Performance:
|
Response to Net |
Bullish |
KC rose 2 times after 2 earnings reports. |
|
Seasonal Success |
Bearish |
KC avg loss 21% in March, breakeven in April prior years. |
|
Earnings Beats |
Bearish |
KC beat Street estimate 1 time after 3 reports. |
|
TTD's Quality Rating of Stock - KC - BELOW AVERAGE |

Stock's Performance Chart with Quarterly Earnings Markers vs. S&P 500
Insider Buying in Green - Insider Selling in Red
TTD columnist Leo Fasciocco has covered the stock market for over 30 years. His articles appear in many publications. He has also been a speaker at the Money Show conferences. He has been on television and radio. He is author of many educational articles about stock investing and the book ōGuide To High-Performance Investing.ö

For information to subscribe to the Ticker Tape Digest Services call: Beverly Owen at 1-480-704-3331.
Distributed by Corona Publishing Enterprises. TickerTape Digest Inc. 1220 W. Sherri, Gilbert, Az. 85233.
TTD ōProfessional Reportö is available on the Web: $100 per month. Password needed. Published daily - around 20 times a month.
TTD Pro Report includes a Morning chart slide show of breakout stocks, a Midsession video-audio show with commentary on breakout stocks and shorts and a Final end of day overall report on breakout stocks for the session, short plays and accumulation plays. There are other features too such as Quick Trades and Long-term Plays.
TTD Daily Report is $39. It covers a Morning slide show of charts of stocks breaking out and a TTD
end of day print report covering breakout stocks and shorts.
Credit cards accepted. Payable to Corona Publishing Enterprises.
(The information contained has been prepared from data deemed reliable but there is no guarantee of complete accuracy. Ticker Tape Digest Inc. is not affiliated with any broker, dealer or investment advisor. Nothing in this publication constitutes an offer, recommendation or solicitation to buy or sell any securities. Further research is advised. This report is copyrighted and no redistribution is permitted with out permission.)
