![]()
|
|
|
Weekly - Bullish Conservative Investors - Go To TTD Long-Term Plays - Monday, March 26, 2018 |
|
|
Go to Video Show - "How to Make Money With Breakout Stocks |
|---|

By Leo Fasciocco -- TTD
Ticker Tape Digest presents its daily stock market report containing stocks to go long as Breakout Trades, Quick Trades, or Bargain Accumulation Trades.
We also feature stocks under Significant Accumulation that are poised to breakout.
|
Ticker Tape Digest's Daily schedule guide for TTD subscribers 1. Pre-market - check Breakout Watch List and Quick Trades. 2. Morning - (11:30 - 12 A.M.) - check breakout stocks tape and breakout chart slide show. 3. Midday (1 P.M.) check TTD Midsession Report and see market video show. 4. After close (4 P.M.) check final TTD Report for day. Trading Strategies Bullish Aggressive Investors Bullish - "Breakout Stocks" - ideally suited for bull markets and special situation stocks. Potential for large returns. (See Performance) Aggressive Investor Bullish- "Quick Trade Stocks" -ideally suited for entry into top performing issues looking for a small quick profit." (See Performance) Conservative Investors "Bargain Buy Trades for the Long Term." Ideally suited for entry into top performing big cap stocks on pullbacks within overall up trend.(See Performance) Bearish Aggressive Bearish Investors - "Breakdown Stocks" to Sell Short. Ideally suited for bear markets or market pull backs. Potential for large returns (See Performance) |
|---|
The TTD report also contains stocks to short as breakdown plays and as bargain (swing trade) shorts.
Investors should tend to try to go with a strategy that fits with the stock market's trend, unless there is a special situation play.
TTD's Breakout Stocks - Long are
most suitable for aggressive investors seeking ideal entry points into leading stocks, especially during bull markets. They can do extremely well in bull markets with gains of as much as several hundred percent. 
These stocks can also do extremely well during strong market rallies, or if they are in a industry group that is performing very well. They tend to have strong earnings outlooks and are near new-52 week, or all-time highs.
TTD Quick Trade Stocks - Long These are leading issues that have pulled back in recent days, but could move higher soon. They are most suitable for Aggressive Investors willing to trade short term. These stocks will do extremely well during market advances. They have about 74% win rate. During market rally sequences the win rate is even higher. The return is small 3% to 8% in just a few days.
TTD's Bargain Buy Trades - Long - Long Term. These are for conservative bullish Investors These long-term buys are ideally suited for entry into stocks on pull backs within overall up trend. These stocks can give a good return long-term especially during a bull market.
TTD also presents Stocks To Sell or Sell Short. These issues are suitable for aggressive investors willing to take short positions both as trades or for longer-term plays. These stocks will do very well during bear markets or market pull backs.
TTD's Bearish breakdown stocks to sell short. These issues have potential to fall sharply. They often show a technical breakdown and also some fundamental business problem such as weak earnings.
TTD's multi-media updates include a slide-show that presents charts and analysis at midsession. Some times TTD presents feature analysis on stocks and the market. TTD uses Windows Media Files. (WMV).
TTD also presents a "Breakout Watch List" that is up dated daily. This list consists of key stocks in position to breakout. A close watch of this list can put you in the stock just as it breaks out. A good idea is to study the list and be ready to move into a stock quickly as it hits its breakpoint.
TTD often suggests using stop buy orders to enter. It is very important to buy a breakout stock as close as possible to the breakpoint. The idea is to get "elbow room" if the stock should follow through to the upside. This is very important in being successful in making big money with breakout stocks.
It is also essential to have a stop loss strategy for all stocks in which positions are taken. Not every stock will work as expected. It is important for investors to "police" their portfolios and avoid getting trapped in any bad positions.
Quality rating of breakout Two key factors: 1 - Stock near all-time high in price or near a 52-week high. 2 - earnings growth current year is strong. The ideal play is a stock with an Above Average Quality Rating. The stock is near a new high and will have strong earnings. TTD's other ratings are Average and Below Average.
TTD also has special feature sections on Educational Tips on Investing.
To email Mr. Leo Fasciocco leo@tickertapedigest.com.
For service, email Beverly Owen owen@tickertapedigest.com. TTD’s Tel: 1-480-926-1680.
Monday - March 26, 2018
TTD's Breakout Stocks
Stock Market Overview
Total Buy Breakouts so far today - 3
Quality of Breakouts - Average.
Stocks Screened - 12,234
Bull side - Small list of breakouts Monday even though the stock market bounces back strongly.
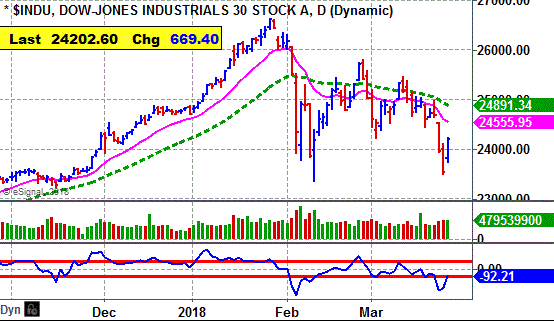
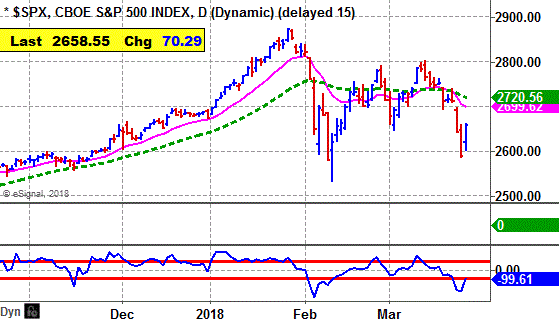
Stock market - Market's daily and weekly indicators are bearish, except for the Nasdaq weekly. The monthly indicators remain bullish. Bulls need to be conservative. Earnings will be coming.
Stock Market Momentum
(Daily is based on a moving average)
|
Market (Daily) |
Market (Weekly) |
Market (Monthly) |
|
Dow - Bearish |
Dow - Bearish |
Dow - Bullish, |
|
Nasdaq - Bearish |
Nasdaq - Bullish |
Nasdaq - Bullish |
|
S&P 500 - Bearish |
S&P 500 - Bearish |
S&P 500 - Bullish |

Ticker Tape Digest's

|
TTD's Quality Rating of Stock - NEOG - ABOVE AVERAGE |
NEOG, based in Lansing, Mich., makes products for food and animal safety. Annual revenues: $362 million. NEOG's stock drive sharply higher and breaks out from a 17-week, cup-and-handle base. 
The breakout was triggered by strong earnings.
So far today, NEOG is trading 285,716 shares. Its average daily volume is 197,000 shares.
NEOG moved higher in the morning and crossed its breakpoint line in the early afternoon.
The stock continued higher and closed near its high for the day. That is bullish. 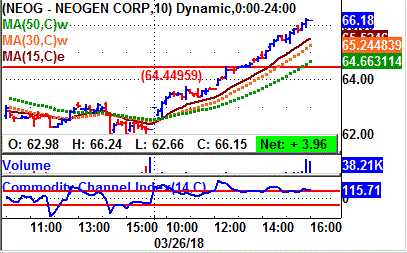
Tape Action
NEOG's tape action shows the recent block trades.
One can see the price for the blocks climbing from $62.19 in the prior session to as high as $66.15.
A key bullish trade came in the morning when a block of 1,370 shares (duplicated) crossed the tape at $62.98.
That was up from the prior block the day before at $62.19 on 3,688 shares.
Near the close Monday a massive block of 37,731 shares (duplicated) crossed the tape at $66.15. 
That was up from the prior block at $66 on 500 shares.
Business
NEOG makes products and provides services for food and animal safety.
The food safety unit produces diagnostic test kits and used by food producers to detect harmful natural toxins, foodborne bacteria, allergens and levels of general sanitation.
The animal safety unit makes consumable products marketed to veterinarians and animal health product distributors.
The unit also provides genetic identification services and sells rodenticides, disinfectants and insecticides to assist in the control of rodents and disease near food production facilities
Charts
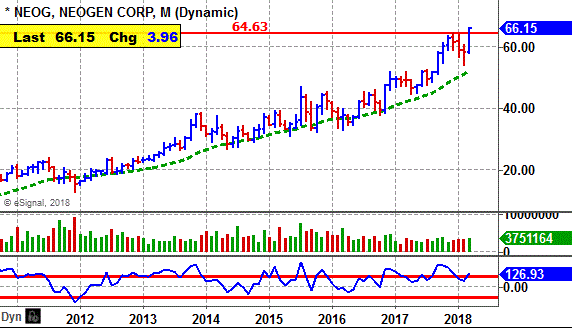
NEOG's 12-month performance chart shows the stock up 35% versus a 15% gain for the stock market.
Insiders were recent buyers using stock options at $29 to $47 a share. They were sellers at $57 to $81 a share.
NEOG's long-term chart shows the stock climbing from $12.79 back in late 2011 to its current peak at $66.24 set Monday, adjusted for a 3-for-2 stock split in 2013. The stock has been a steady climber with very modest pull backs. 
NEOG's daily chart shows the stock peaking near $63 back in December.
The stock then pulled back to as low as $55 by February, but rallied to form a four month cup-and-handle base.
The breakout Monday is strong coming with a widening of the day spread. It enables NEOG to cut through a breakpoint zone.
NEOG's CCI momentum indicator (bottom of chart) is solidly bullish.
Earnings Outlook:
This fiscal year ending in May of 2018 analysts are forecasting a 26% increase in net to $1.08 a share from the 86 cents the year before.
The stock sells with a price-earnings ratio of 61. That is high. So, the stock is best for aggressive investors.
Looking out to fiscal 2019 ending in May, the Street is predicting a more modest 11% increase in net to $1.19 a share from the anticipated $1.08 this year.
Quarterly net should be strong.
Net for the upcoming fiscal fourth quarter ending in May, analysts look for a 29% jump in net to 31 cents a share from the 24 cents the year before.
TTD sees good chances for an upside earnings surprise. NEOG topped the consensus estimate the past two quarters by 8 cents a share and 7 cents.
Going out to the fiscal first quarter ending in August, the Street expects a 26% gain in net to 29 cents a share from the 23 cents the year before.
Strategy Opinion: TTD is targeting NEOG for a move to $80 off this breakout. A protective stop can be placed near $63.
Intermediate-Term Rating: Average.
Suitability: Aggressive Bulls.
TTD's special research of Stock's Prior Performance:
Probability - Breakout Success - Bullish. NEOG has tended to score just modest gains off its recent breakouts. However, the stock is in a strong up trend.
Probability - Earnings Response - Bearish. NEOG rose just 2 times after the past 7 earnings reports when there was a significant change.
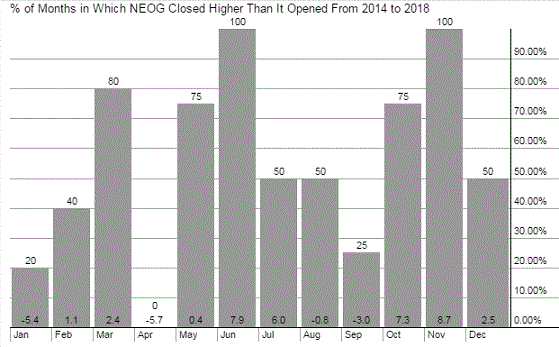
Probability: Seasonal Success - Slightly Bearish - NEOG rose an average of 2.4% in March but declined an average of 5.7% in April the past several years.
Stock's Prior Performance After A Breakout
|
Stock's % Change from Breakout to peak - prior to cut below 50-day M/A. |
Date of Breakout |
Break point Price |
Stocks Price Peak after Breakout - prior to cut below 50-day M/A |
Date Trade Closed |
|
19% |
9/12/2017 |
52.60 |
63.02 |
11/29/2017 |
|
13% |
6/29/2015 |
40.29 |
45.68 |
9/2/2016 |
|
7% |
12/17/2014 |
34.45 |
36.82 |
12/18/2014 |
|
24% |
10/1/2013 |
30.07 |
37.53 |
12/2/2013 |
(In actual trading, entry and exit points could vary depending on broker execution.
Also, ideal are breakouts to a new 52-week high or better, perhaps all-time highs.)
Stock's Long-term Chart
Stock's Performance Chart with Quarterly Earnings Markers vs. S&P 500
Insider Buying in Green - Insider Selling in Red

Stock's Monthly Seasonal Performance Chart - Past 5 Years
Showing % Months UP and % Change
| TTD's Breakout Profile Rating Neogen Corp. (NEOG) |
| TTD Check List | Bullish | Bearish | Neutral |
| Near 52-week High | YES | ||
| Volume | YES | ||
| Tick Volume | YES | ||
| Price Trend - Daily | YES | ||
| Price Trend - Long Term | YES | ||
| Price Daily Spread | YES | ||
| Base Structure | YES | ||
| Base - A-D | YES | ||
| Earnings-Quarterly | YES | ||
| Earnings-Long Term | YES | ||
| Earnings Outlook | YES | ||
| Industry Group | YES | ||
| Prior Breakout Success | YES | ||
| Fund Sponsorship | YES | ||
| Total Score | 13 | 0 | 1 |
Charts of Selected Breakout Stocks
|
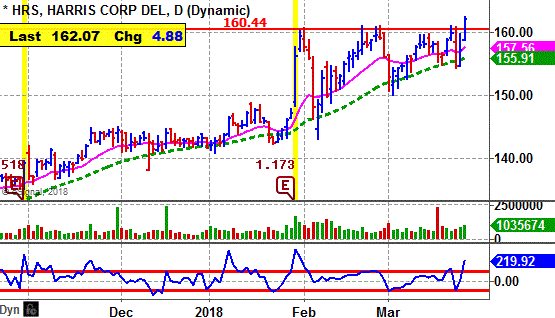
TTD's Quality Rating of Stock - HRS - AVERAGE |
|
TTD's Quality Rating of Stock - EGAN - BELOW AVERAGE |


Ticker Tape Digest’s Daily List of “Stocks To Sell or Sell Short” ranks stocks well timed to be sold immediately based on daily trading. The list can be used as an alert to reduce current long-term positions.
Shorts from tape action so far today - 8
Stocks Screened - 12,234
Long-Term Environment for bears: Neutral.
Bear Side - Small list of breakdown stocks Monday, but some interesting plays.
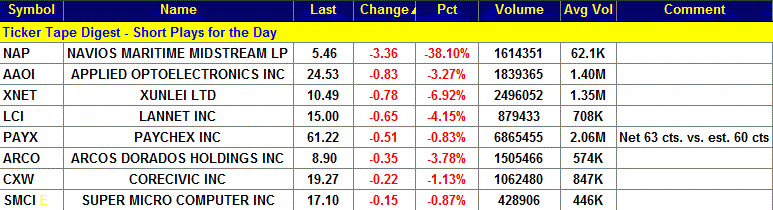
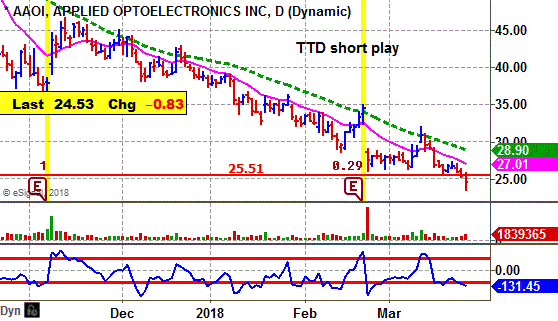
AAOI, based in Sugar Land, Tex., makes fiber-optic networking products. Annual revenue: $382 million. AAOI declines Monday and undercuts key technical support. TTD sees more on the downside. 
So far today, AAOI is trading $1.8 million shares. Its average daily volume is 1.4 million shares.
AAOI fell in the morning and touched a low of $23.51 in the early afternoon.
The stock then rallied to get back to $24.83. However, in the final minutes the stock took a dive down to $23.90. That is very bearish. 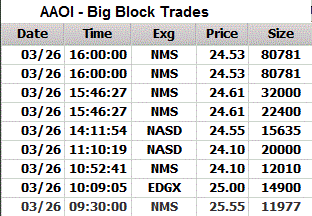
The company reported fourth quarter net on a diluted basis fell to 28 cents a share from 77 cents the year before.
Revenues dropped to $79.9 million from $84.9 million the year before.
Tape Action
AAOI's tape action shows the recent block trades.
One can see the price for the blocks falling from $25.55 in the morning to as low as $24.10.
A key bearish trade came in the morning when a block of 14,900 shares crossed the tape at $25.
That was down from the prior block trade at $25.55 on 11,977 shares.
Business
AAOI produces fiber-optic networking products, primarily for networking end markets, such as Internet data center, cable television, fiber-to-the-home and telecommunications.
The company also makes optical communications such as components, subassemblies and modules to turnkey equipment.
In addition, AAOI makes lasers, transmitters and transceivers, and turnkey equipment for the CATV market.
Earnings:
This year, analysts are forecasting a 49% drop in AAOI's earnings to $2.35 a share from the $4.62 in 2017,
Net for the first quarter is expected to tumble 70% to 33 cents a share from the $1.10 the year before.
Charts:
AAOI's daily chart shows the stock trending down from $45 in November to around $27 by February. The stock tried to make a bottom, but Monday cuts below key technical support with a pick up in volume.
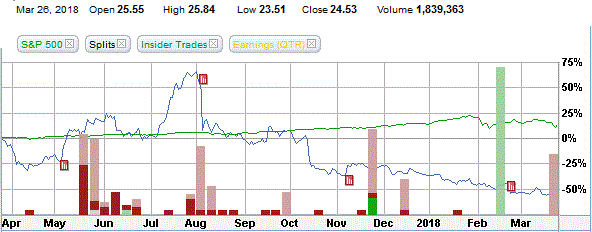
AAOI's 12-month performance chart shows the stock down 52% versus a 16% gain for the stock market.
Strategy Opinion: TTD is targeting AAOI for a decline to $20 within the next few months, or sooner. A protective stop buy can be placed near $25.50.
Suitability: Average Bears.
TTD's special probability research of Prior Performance:
Probability - Earnings Response - Extremely Bearish. AAOI rose just 3 times after the past 10 earnings reports when there was a significant change.
Probability: Seasonal Activity - Bearish. AAOI rose an average of 1.7% in March but fell an average of 10.7% in April the past several years.
|
TTD's Quality Rating of Stock - AAOI - BELOW AVERAGE |
Stock Performance Chart with Quarterly Earnings Markers vs. S&P 500
Insider Buying in Green - Insider Selling in Red
TTD columnist Leo Fasciocco has covered the stock market for over 30 years. His articles appear in many publications. He has also been a speaker at the Money Show conferences. He has been on television and radio. He is author of many educational articles about stock investing and the book “Guide To High-Performance Investing.”

For information to subscribe to the Ticker Tape Digest Services call: Beverly Owen at 1-480-926-1680.
Distributed by Corona Publishing Enterprises. TickerTape Digest Inc. 1220 W. Sherri, Gilbert, Az. 85233.
TTD “Professional Report” is available on the Web: $100 per month. Password needed. Published daily - around 20 times a month.
TTD Pro Report includes a Morning chart slide show of breakout stocks, a Midsession video-audio show with commentary on breakout stocks and shorts and a Final end of day overall report on breakout stocks for the session, short plays and accumulation plays. There are other features too such as Quick Trades and Long-term Plays.
TTD Daily Report is $39. It covers a Morning slide show of charts of stocks breaking out and a TTD end of day print report covering breakout stocks and shorts.
Credit cards accepted. Payable to Corona Publishing Enterprises.
(The information contained has been prepared from data deemed reliable but there is no guarantee of complete accuracy. Ticker Tape Digest Inc. is not affiliated with any broker, dealer or investment advisor. Nothing in this publication constitutes an offer, recommendation or solicitation to buy or sell any securities. Further research is advised. This report is copyrighted and no redistribution is permitted with out permission.)
