![]()
|
|
|
Go to Video Show - "How to Make Money With Breakout Stocks |
|---|

By Leo Fasciocco -- TTD
Ticker Tape Digest presents its daily stock market report containing stocks to go long as Breakout Trades, Quick Trades, or Bargain Accumulation Trades.
We also feature stocks under Significant Accumulation that are poised to breakout.
|
Ticker Tape Digest's Daily schedule guide for TTD subscribers 1. Pre-market - check Breakout Watch List and Quick Trades. 2. Morning - (11:30 - 12 A.M.) - check breakout stocks tape and breakout chart slide show. 3. Midday (1 P.M.) check TTD Midsession Report and see market video show. 4. After close (4 P.M.) check final TTD Report for day. Trading Strategies Bullish Aggressive Investors Bullish - "Breakout Stocks" - ideally suited for bull markets and special situation stocks. Potential for large returns. (See Performance) Aggressive Investor Bullish- "Quick Trade Stocks" -ideally suited for entry into top performing issues looking for a small quick profit." (See Performance) Conservative Investors "Bargain Buy Trades for the Long Term." Ideally suited for entry into top performing big cap stocks on pullbacks within overall up trend.(See Performance) Bearish Aggressive Bearish Investors - "Breakdown Stocks" to Sell Short. Ideally suited for bear markets or market pull backs. Potential for large returns (See Performance) |
|---|
The TTD report also contains stocks to short as breakdown plays and as bargain (swing trade) shorts.
Investors should tend to try to go with a strategy that fits with the stock market's trend, unless there is a special situation play.
TTD's Breakout Stocks - Long are
most suitable for aggressive investors seeking ideal entry points into leading stocks, especially during bull markets. They can do extremely well in bull markets with gains of as much as several hundred percent. 
These stocks can also do extremely well during strong market rallies, or if they are in a industry group that is performing very well. They tend to have strong earnings outlooks and are near new-52 week, or all-time highs.
TTD Swng - Quick Trade Stocks - Long These are leading issues that have pulled back in recent days, but could move higher soon. They are most suitable for Aggressive Investors willing to trade short term. These stocks will do extremely well during market advances. They have about 74% win rate. During market rally sequences the win rate is even higher. The return is small 3% to 8% in just a few days.
TTD also presents Stocks To Sell or Sell Short. These issues are suitable for aggressive investors willing to take short positions both as trades or for longer-term plays. These stocks will do very well during bear markets or market pull backs.
TTD's Bearish breakdown stocks to sell short. These issues have potential to fall sharply. They often show a technical breakdown and also some fundamental business problem such as weak earnings.
TTD's multi-media updates include a slide-show that presents charts and analysis at midsession. Some times TTD presents feature analysis on stocks and the market. TTD uses Windows Media Files. (WMV).
TTD also presents a "Breakout Watch List" that is up dated daily. This list consists of key stocks in position to breakout. A close watch of this list can put you in the stock just as it breaks out. A good idea is to study the list and be ready to move into a stock quickly as it hits its breakpoint.
TTD often suggests using stop buy orders to enter. It is very important to buy a breakout stock as close as possible to the breakpoint. The idea is to get "elbow room" if the stock should follow through to the upside. This is very important in being successful in making big money with breakout stocks.
It is also essential to have a stop loss strategy for all stocks in which positions are taken. Not every stock will work as expected. It is important for investors to "police" their portfolios and avoid getting trapped in any bad positions.
Quality rating of breakout Two key factors: 1 - Stock near all-time high in price or near a 52-week high. 2 - earnings growth current year is strong. The ideal play is a stock with an Above Average Quality Rating. The stock is near a new high and will have strong earnings. TTD's other ratings are Average and Below Average.
TTD also has special feature sections on Educational Tips on Investing.
To email Mr. Leo Fasciocco leo@tickertapedigest.com.
For service, email Beverly Owen owen@tickertapedigest.com. TTD’s Tel: 1-480-878-8381 or 480-704-3331.
Friday - March 26, 2021
TTD's Breakout Stocks
Stock Market Overview
Total Buy Breakouts - 23
Quality of Breakouts - Above Average.
Stocks Screened - 12,234
Bull side - Large list of breakouts with some interesting plays for aggressive bulls.
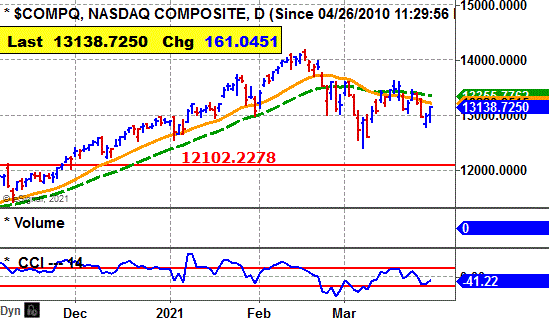
Stock market - Major averages are bullish in all time sectors, except for the daily NASDAQ which is bearish.
Comment - Large list of breakouts with some good looking plays. Housing stock breaking out. Bulls be can be venturesome but one needs to be alert for upcoming earnings.
See Latest Earnings Reports - A company that tops the Street's highest earnings estimate has potential to go higher. Key earnings beats - IDCBY.
Stock Market Momentum
(Daily is based on a moving average)
|
Market (Daily) |
Market (Weekly) |
Market (Monthly) |
|
Dow - Bullish |
Dow - Bullish |
Dow - Bullish |
|
Nasdaq - Bearish |
Nasdaq - Bullish |
Nasdaq - Bullish |
|
S&P 500 - Bullish |
S&P 500 - Bullish |
S&P 500 - Bullish |


 Ticker Tape Digest's
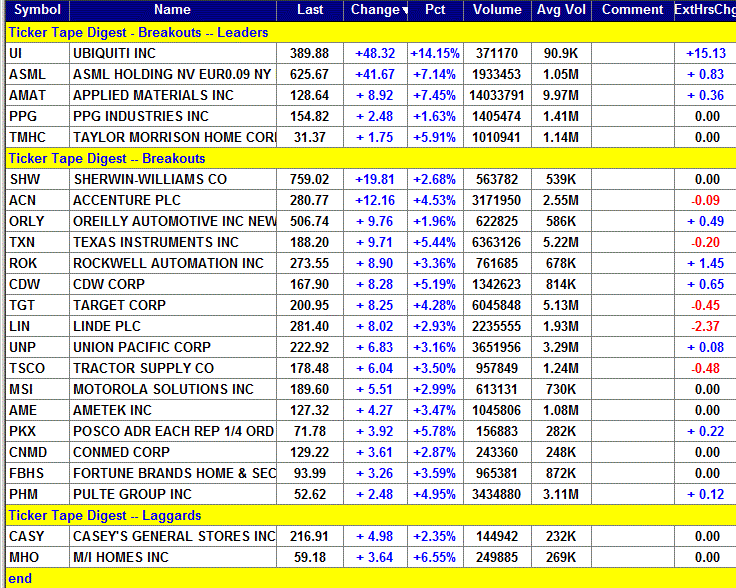
|
TTD's Quality Rating of Stock - UI - ABOVE AVERAGE |
UI, based in New York, formerly Ubiquiti Networks, Inc., provides networking technology for service providers. Annual revenues: $1.3 billion. UI's stock drives higher Friday and breaks out from its eight-week flat base.
So far today, UI is trading a heavy 371,185 shares, four times its average daily volume of 91,000 shares.
UI's stock has now reached a new all-time high. That is bullish.
TTD sees potential for more on the upside.
UI's stock gapped higher in the morning and cleared its breakpoint line.
The stock reached an intraday peak at $396 around noon.
UI then backed off a bit but then rallied late in the session to finish with a good gain. 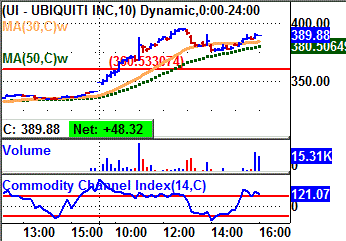
However, in after-hours trading, the stock was down $9.88.
Tape Action
UI's tape action shows the recent block trades.
One can see the price for the blocks climbing from $341.56 in the prior session to as high as $392.46 in the morning.
A key bullish trade came in the morning when a block of 2,612 shares (duplicated) crossed the tape at $347.51.
That was up sharply from the prior block at $341.56 on 3,970 shares in the prior session.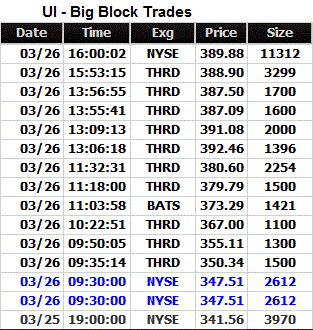
Business
UI's service provider product platforms provide carrier-class network infrastructure for fixed wireless broadband, wireless backhaul systems and routing.
Its enterprise product platforms provide wireless local area network infrastructure, video surveillance products, switching and routing solutions, and machine-to-machine communication components.
Its products and solutions include radios, antennas, software, communications protocols and management tools.
Charts
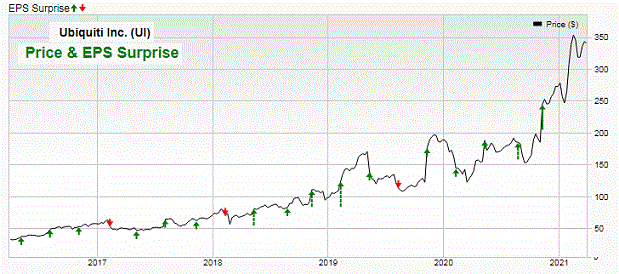
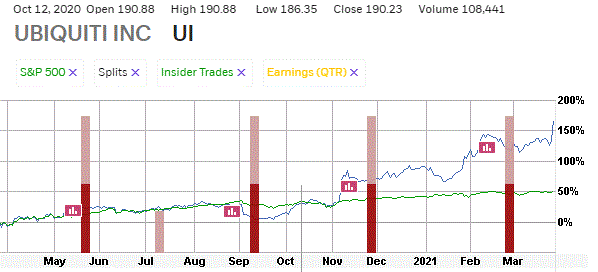
UI's 12-month performance chart shows the stock up 160% versus a 50% gain for the stock market.
Insiders were recent buyers at $10.77 a share. They were sellers at $347 to $161 a share.
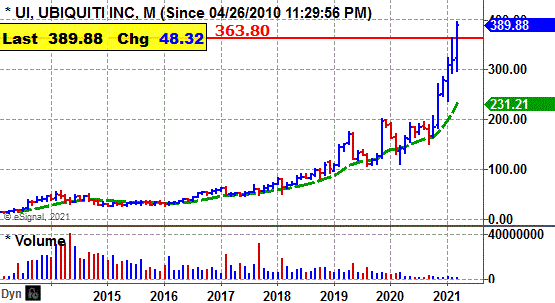
UI's long-term chart shows the stock climbing from $27.50 back in 2016 to a peak at $199 in 2019.
The stock then fell back to $110 in 2020. UI has since surged to $389.
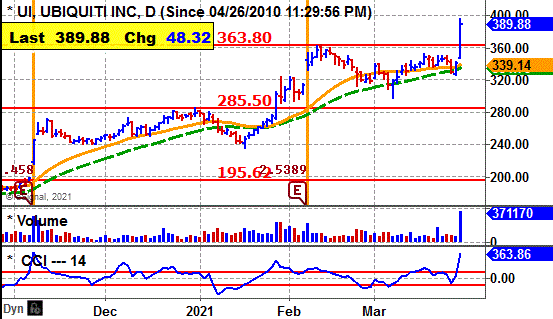
UI's daily chart shows the stock advancing from $200 in December to a peak at $363 in February.
The stock formed a flat base.
The breakout comes with a gap move on big volume.
That is very strong.
The stock's CCI momentum indicator is strongly bullish.
Earnings Outlook
Net for the fiscal year ending in June of 2021 the Street predicts a 73% surge in net to $10.23 a share from the $5.91 the prior year.
Analysts have been raising their estimates.
Looking out to fiscal 2022 ending June, the Street projects a 19% increase in net to $12.18 a share from the anticipated $10.23 in the current fiscal year.
Net for the fiscal third quarter ending in March, the Street predicts a 61% spurt in net to $2.59 a share from the $1.61 the prior year.
Strategy Opinion: TTD is targeting UI for a move to $460 after a breakout. A protective stop can be placed near $355 after a breakout.
Intermediate-Term Rating: Average.
Suitability: Average Bulls.
TTD's special research of Stock's Prior Performance:
|
Breakout Success |
Bullish |
UI scored big gains off recent breakouts. |
|
Response to Net |
Bullish |
UI rose 12 times after 15 earnings reports. |
|
Seasonal Success |
Bearish |
UI avg. gain 5.2% in March, gain 5.6% in April prior years. |
|
Earnings Beats |
Bullish |
UI beat Street net estimate 4 times after 5 reports. |
Stock's Prior Performance After A Breakout
|
Stock's % Change from Breakout to peak - prior to cut below 50-day M/A. |
Date of Breakout |
Break point Price |
Stocks Price Peak after Breakout - prior to cut below 50-day M/A |
Date Trade Closed |
|
26% |
1/26/2021 | 284.13 | 357.07 | 2/9/2021 |
|
39% |
11/6/2020 | 200.74 | 278.93 | 12/30/2020 |
|
35% |
11/8/2019 | 146.81 | 198.30 | 11/27/2019 |
|
37% |
2/8/2019 | 124.53 | 170.52 | 4/23/2019 |
|
18% |
5/9/2018 | 74.79 | 87.35 | 6/18/2018 |
(In actual trading, entry and exit points could vary depending on broker execution.
Also, ideal are breakouts to a new 52-week high or better, perhaps all-time highs.)
Stock's Long-term Chart
Stock's Price Performance after Reporting Earnings
Stock's Performance Chart with Quarterly Earnings Markers vs. S&P 500
Insider Buying in Green - Insider Selling in Red
Charts of Selected Breakout Stocks
|
TTD's Quality Rating of Stock - ASML - ABOVE AVERAGE |

|
TTD's Quality Rating of Stock - AMAT - ABOVE AVERAGE |

|
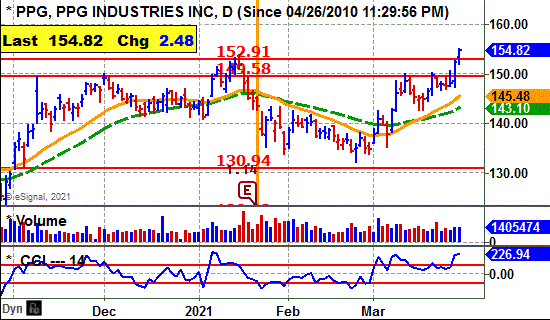
TTD's Quality Rating of Stock - PPG - ABOVE AVERAGE |
|
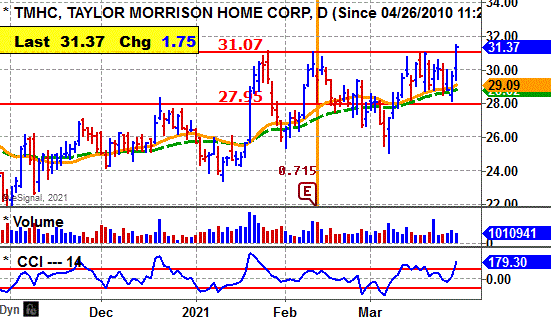
TTD's Quality Rating of Stock - TMHC - ABOVE AVERAGE |

Ticker Tape Digest’s Daily List of “Stocks To Sell or Sell Short” ranks stocks well timed to be sold immediately based on daily trading. The list can be used as an alert to reduce current long-term positions.
Shorts from tape action - 3
Stocks Screened - 12,234
Long-Term Environment for bears:
Bear Side - Small list of shorts. Bears be conservative. TTD's short from Thursday was Vital Farms Inc. (VITL) at 21.36. Friday, VITL declined 24 cents to $21.12.
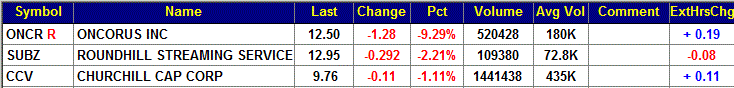
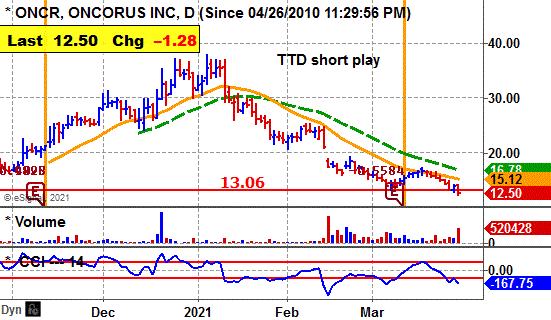
ONCR, based in Cambridge, Ma., is a biotech firm working on treatments for cancer. Annual revenues: Nil. ONCR's stock falls sharply Friday undercutting key technical support. 
So far today, ONCR is trading a heavy 520,733 shares, triple its average daily volume of 180,000 shares.
TTD sees potential for more on the downside with this speculative medical play.
ONCR cut below key support in the morning. 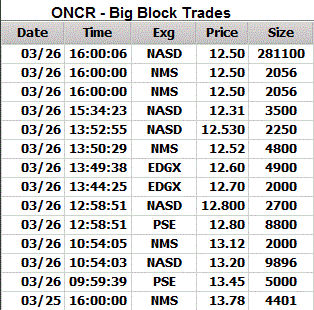
It trended lower finally touching an intraday low at $12.18 in the afternoon.
The stock then trended sideways.
It was unchanged in after-hours trading.
Tape Action
ONCR's tape action shows the recent block trades.
One can see the price for the blocks falling from $13.78 in the prior session to as low as $12.31 in the afternoon.
A key bearish trade came in the morning when a block of 5,000 shares crossed the tape at $13.45.
That was down from the prior block the day before at $13.78 on 4,401 shares.
Business
ONCR is a clinical stage bio tech firm working on viral immunotherapies for cancer.
The company is leveraging its platforms to develop a pipeline of intratumorally and intravenously administered product candidates to selectively attack and kill tumor cells and stimulate the immune system against tumors.
Its lead product candidates are ONCR-177, ONCR-GBM, Synthetic Coxsackievirus (CV)A21 and Synthetic Seneca Valley Virus (SVV).
Earnings:
This year, the Street predicts ONCR will show a loss of $2.47 a share compared with a loss of $9.35 the prior year.
Going out to 2022, they predict a loss of $2.69 a share compared with the anticipated loss of $2.47 this year.
For the first quarter, a loss of 54 cents a share is predicted.
Charts:
ONCR's daily chart shows the stock climbing from $15 back in 2020 to a peak at $37 in January of this year.
However, since then it has all been down hill with the stock falling to $12.50.
Strategy Opinion: TTD is targeting ONCR for a decline to $9.50 within the next few months, or sooner. A protective stop buy can be placed near $14.
Suitability: Aggressive Bears.
TTD's Stock Probability research of Prior Performance:
|
Response to Net |
Bearish |
ONCR fell 1 time after 1 earnings reports. |
|
Earnings Beats |
Bearish |
ONCR missed Street estimate 1 time after 1 report. |
|
TTD's Quality Rating of Stock - ONCR - BELOW AVERAGE |
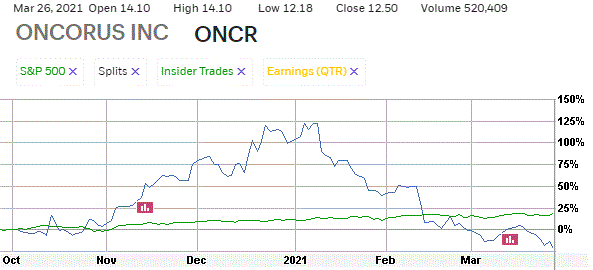
Stock's Performance Chart with Quarterly Earnings Markers vs. S&P 500
Insider Buying in Green - Insider Selling in Red
TTD columnist Leo Fasciocco has covered the stock market for over 30 years. His articles appear in many publications. He has also been a speaker at the Money Show conferences. He has been on television and radio. He is author of many educational articles about stock investing and the book “Guide To High-Performance Investing.”

For information to subscribe to the Ticker Tape Digest Services call: Beverly Owen at 1-480-704-3331.
Distributed by Corona Publishing Enterprises. TickerTape Digest Inc. 1220 W. Sherri, Gilbert, Az. 85233.
TTD “Professional Report” is available on the Web: $100 per month. Password needed. Published daily - around 20 times a month.
TTD Pro Report includes a Morning chart slide show of breakout stocks, a Midsession video-audio show with commentary on breakout stocks and shorts and a Final end of day overall report on breakout stocks for the session, short plays and accumulation plays. There are other features too such as Quick Trades and Long-term Plays.
TTD Daily Report is $39. It covers a Morning slide show of charts of stocks breaking out and a TTD end of day print report covering breakout stocks and shorts.
Credit cards accepted. Payable to Corona Publishing Enterprises.
(The information contained has been prepared from data deemed reliable but there is no guarantee of complete accuracy. Ticker Tape Digest Inc. is not affiliated with any broker, dealer or investment advisor. Nothing in this publication constitutes an offer, recommendation or solicitation to buy or sell any securities. Further research is advised. This report is copyrighted and no redistribution is permitted with out permission.)