Daily - Go to TTD's Tape of Stock Charts - Tuesday, March 27
|
Daily - Go to TTD's Tape of Stock Charts - Tuesday, March 27 |
|
Weekly - Bullish Conservative Investors - Go To TTD Long-Term Plays - Monday, March 26 |
|
Go to Video Show - "How to Make Money With Breakout Stocks" |
|---|

By Leo Fasciocco -- TTD
Ticker Tape Digest presents its daily stock market report containing stocks to go long as breakout trades, quick trades, or bargain trades. We also feature stocks under Significant Accumulation that are poised to breakout.
|
Ticker Tape Digest's Daily schedule guide for TTD subscribers 1. Pre-market - check Breakout Watch List and Quick Trades. 2. Morning - (11:30 - 12 A.M.) - check breakout stocks tape and breakout chart slide show. 3. Midday (1 P.M.) check TTD Midsession Report and see market video show. 4. After close (4 P.M.) check final TTD Report for day. Trading Strategies Bullish Aggressive Investors Bullish - "Breakout Stocks" - ideally suited for bull markets and special situation stocks. Potential for large returns. (See Performance) Aggressive Investor Bullish- "Quick Trade Stocks" -ideally suited for entry into top performing issues looking for a small quick profit." (See Performance) Conservative Investors "Bargain Buy Trades for the Long Term." Ideally suited for entry into top performing big cap stocks on pullbacks within overall up trend.(See Performance) Bearish Aggressive Bearish Investors - "Breakdown Stocks" to Sell Short. Ideally suited for bear markets or market pull backs. Potential for large returns (See Performance) |
|---|
The TTD report also contains stocks to short as breakdown plays and as bargain (swing trade) shorts.
Investors should tend to try to go with a strategy that fits with the stock market's trend, unless there is a special situation play.
TTD's Breakout Stocks - Long are
most suitable for aggressive investors seeking ideal entry points into leading stocks, especially during bull markets. They can do extremely well in bull markets with gains of as much as several hundred percent. 
These stocks can also do extremely well during strong market rallies, or if they are in a industry group that is performing very well. They tend to have strong earnings outlooks and are near new-52 week, or all-time highs.
TTD Quick Trade Stocks - Long These are leading issues that have pulled back in recent days, but could move higher soon. They are most suitable for Aggressive Investors willing to trade short term. These stocks will do extremely well during market advances. They have about 74% win rate. During market rally sequences the win rate is even higher. The return is small 3% to 8% in just a few days.
TTD's Bargain Buy Trades - Long - Long Term. These are for conservative bullish Investors These long-term buys are ideally suited for entry into stocks on pull backs within overall up trend. These stocks can give a good return long-term especially during a bull market.
TTD also presents Stocks To Sell or Sell Short. These issues are suitable for aggressive investors willing to take short positions both as trades or for longer-term plays. These stocks will do very well during bear markets or market pull backs.
TTD's Bearish breakdown stocks to sell short. These issues have potential to fall sharply. They often show a technical breakdown and also some fundamental business problem such as weak earnings.
TTD's multi-media updates include a slide-show that presents charts and analysis at midsession. Some times TTD presents feature analysis on stocks and the market. TTD uses Windows Media Files. (WMV).
TTD also presents a "Breakout Watch List" that is up dated daily. This list consists of key stocks in position to breakout. A close watch of this list can put you in the stock just as it breaks out. A good idea is to study the list and be ready to move into a stock quickly as it hits its breakpoint.
TTD often suggests using stop buy orders to enter. It is very important to buy a breakout stock as close as possible to the breakpoint. The idea is to get "elbow room" if the stock should follow through to the upside. This is very important in being successful in making big money with breakout stocks.
It is also essential to have a stop loss strategy for all stocks in which positions are taken. Not every stock will work as expected. It is important for investors to "police" their portfolios and avoid getting trapped in any bad positions.
Quality rating of breakout Two key factors: 1 - Stock near all-time in price or near a 52-week high. 2 - earnings growth current year is strong. The ideal play is a stock with an Above Average Quality Rating. The stock is near a new high and will have strong earnings. TTD's other ratings are Average and Below Average.
TTD also has special feature sections on Educational Tips on Investing.
To email Mr. Leo Fasciocco leo@tickertapedigest.com.For service, email Beverly Owen owen@tickertapedigest.com. TTD’s Tel: 1-480-926-1680.
Breakout Stocks
Total Buy Breakouts so far today - 11
Overall Quality of Breakouts - Average
Stocks Screened - 8,300
Bull side - Good number of breakouts with some good looking plays. Bulls can be venturesome. Stock market holds in up trend with momentum still bullish.
(Put mouse on Dow chart to see Nasdaq chart)
Long Term Environment for bulls: Neutral
Market (Daily) - NYSE Bullish, Nasdaq Bullish
Market (Weekly) - NYSE Bullish, Nasdaq Bullish
Market (Monthly) - NYSE Bullish, Nasdaq Bullish
Ticker Tape Digest's
|
TTD's Quality Rating of Stock - BCEI - ABOVE AVERAGE |
BCEI, based in Denver, produces oil and natural gas. Annual revenues: $64 million. BCEI's stock, a recent IPO, breaks out today from a six-week flat base and pushes to a new all-time high. So far today BCEI is trading 725,392 shares, triple its normal daily volume of 228,000 shares. BCEI came public in December and traded around 15. 
TTD highlighted BCEI at our midsession video show on the Web Tuesday.
BCEI's 10-minute chart shows the stock spiking higher in the morning to clear its breakpoint. The move came on a good expansion in intraday volume.
The stock then trended sideways most of the day.
TTD's clip of the tape shows the recent big block trades.
 One can see the price for the blocks rising from $19.50 to as high as $22.04.
A key bullish trade came in the morning when a block of 6,400 shares crossed at $21.50, up from the prior block trade at $19.50.
The price for the blocks dipped a bit late in the day. That indicated some institutional profit taking.
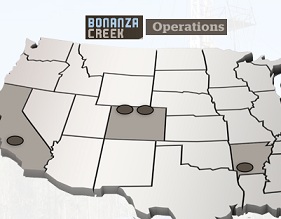
BCEI acquires, develops and produces onshore oil and associated liquids-rich natural gas in the United States.
The company’s operations are focused primarily in southern Arkansas (Mid-Continent region) and the Denver Julesburg (DJ) and North Park Basins in Colorado (Rocky Mountain region).
It owns and operates oil producing assets in the San Joaquin Basin (California region).
BCEI's 12-month performance chart shows the stock appreciating 58% versus a 10% gain for the S&P 500. Note on the chart the heavy insider buying that took place just before the stock advanced strongly.
BCEI's long-term chart show the stock trading around 13 late last year. It has since trended higher nicely above its rising 50-day moving average line. The push to a new high could bring in more buying on Wednesday.
BCEI's daily chart shows the stock climbing from 13 to 19, where it set up a flat base. The stock edged out of its base on Monday. Today, it clears the base easily.
The action shows good buying interest.
The stock's TTD momentum indicator (top of chart) is strongly bullish.
The accumulation - distribution line (bottom of chart) is in a solid up trend. That shows there has been solid buying supporting the stock's advance.
This year, analysts are forecasting a 192% surge in net to $1.52 a share from 52 cents a year ago. The stock sells with a price-earnings ratio of just 13. TTD sees that as very low making the stock very attractive to value-growth investors.
Next year, analysts project an 85% jump in net to $2.80 a share from the anticipated $1.52 this year. If one gives the stock a p/e of 20, the stock has a potential value of $56.
Strategy Opinion: TTD is targeting BCEI for a move to 26 off this breakout. The stock is hot until proven otherwise. A protective stop can be placed near 19.50. TTD rates BCEI a very good intermediate-term play provided earnings remain on course.
Sponsorship: Very Good. The largest fund holder is 4-star rated Hartford Small Company HLS Fund with a 0.29% stake. It was a recent buyer of 113,600 shares. Also, 3-star rated Hartford Small Company A Fund added 70,510 shares. BCEI has 39.5 million shares outstanding.
Insider Activity: Bullish Insiders have been steady buyers of the stock in the $13 to $14 area earlier this year. (see chart) They have not done any selling. Six analysts follow the stock, 5 have a buy.
Stock Performance Chart with Quarterly Earnings Markers
Insider Activity - Buying in Green - Selling in Red
| TTD's Breakout Profile
Rating Bonanza Creek Energy Inc. - (BCEI) |
| TTD Check List | Bullish | Bearish | Neutral |
| Near 52-week High | YES | ||
| Volume | YES | ||
| Tick Volume | YES | ||
| Price Trend - Daily | YES | ||
| Price Trend - Long Term | YES | ||
| Price Daily Spread | YES | ||
| Base Structure | YES | ||
| Base - A-D | YES | ||
| Earnings-Quarterly | YES | ||
| Earnings-Long Term | YES | ||
| Earnings Outlook | YES | ||
| Industry Group | YES | ||
| Prior Breakout Success | YES | ||
| Fund Sponsorship | YES | ||
| Total Score | 14 | 0 | 0 |
Charts of Selected Breakout Stocks
| TTD's Quality Rating of Stock - FMC - AVERAGE |
| TTD's Quality Rating of Stock - AVG - AVERAGE |
| TTD's Quality Rating of Stock - YELP - AVERAGE |
| TTD's Quality Rating of Stock - VSI - AVERAGE |

Ticker Tape Digest’s Daily List of “Stocks To Sell or Sell Short” ranks stocks well timed to be sold immediately based on daily trading. The list can be used as an alert to reduce current long-term positions.
Shorts from tape action so far today - 2
Stocks Screened - 8,300
Long-Term Environment for bears: Unfavorable.
Bear Side - Only two breakdown stocks today. Bears remain conservative and selective. Stock market remains in an up trend. TTD's short from Monday was Telecom Argentina (TEO) at 17.57. Today, it is trading at 17.56 so far.
APOL, based in Phoenix, provides educational services. Annual revenues: $4.6 billion. APOL's stock gaps lower today on heavy volume after the company reported lower operating earnings for the fiscal second quarter ended February 28. So far today, APOL is trading a heavy 8.1 million shares, more than double its normal daily volume of 3 million shares. TTD sees more on the downside. 
APOL came in with operating net for the quarter of 58 cents a share, down from 83 cents a share a year ago.
The stock moved lower in the morning and then trended sideways the rest of the day. It hit an intraday low of 39.24. The stock's inability to rally is very bearish.
The tape action shows the recent big block trades.
One can see the price of the blocks declining from $43.20 to $39.75. A key bearish trade came when a block of 50,200 shares (duplicated) crossed the tape at $40.22. That was down from the prior block trade at $43.20. The sharp decline indicated aggressive institutional selling pressure.
APOL offers educational programs and services both online and on-campus at the undergraduate, master’s and doctoral levels.
It operates through The University of Phoenix, Inc.; Institute for Professional Development, the College for Financial Planning Institutes Corporation and Meritus University, Inc.
This fiscal year ending August of 2012 analysts forecast a 35% decline in net to $3.23 a share from $4.94 a year ago. Net for the upcoming quarter ending in May they see a 34% drop in net to 95 cents a share from $1.45 a year ago.
APOL's daily charts shows the stock with a gap drop in late February. Then the stock tried to form a bottom. However, today it gaps lower again. The stock's accumulation - distribution line (bottom of chart) is in a down trend indicating clear selling pressure.
Strategy Opinion: TTD is targeting APOL for a decline to 32 within the next few months, or sooner. A protective stop buy can be placed near 41.50.
| TTD's Quality Rating of Stock -APOL - BELOW AVERAGE |
TTD columnist Leo Fasciocco has covered the stock market for over 20 years. His articles appear in many publications. He is also a speaker at the Intershow conferences. He has been on television and radio. He is author of many educational articles about stock investing and the book “Guide To High-Performance Investing.”

For information to subscribe to the Ticker Tape Digest Services call: B. J. Owen at 1-480-926-1680. Distributed by Corona Publishing Enterprises. Ticker Tape Digest Inc. P.O. Box 2044 Chandler, Az. 85244-2044. TTD “Professional Report” is available on the World Wide Web: $100 per month. Password needed. “TTD Professional“ Faxed is $200 per month. The TTD Daily Report is $39.95. Credit cards accepted.
(The information contained has been prepared from data deemed reliable but there is no guarantee of complete accuracy. Ticker Tape Digest Inc. is not affiliated with any broker, dealer or investment advisor. Nothing in this publication constitutes an offer, recommendation or solicitation to buy or sell any securities. Further research is advised. This report is copyrighted and no redistribution is permitted with out permission.)