Daily - Go to TTD's Chart scroller of Breakout Stocks - Tuesday, March 28, 2017
|
Daily - Go to TTD's Chart scroller of Breakout Stocks - Tuesday, March 28, 2017 |
|
Weekly - Bullish Conservative Investors - Go To TTD Long-Term Plays - Monday, March 20, 2017 |
|
|
Go to Video Show - "How to Make Money With Breakout Stocks |
|---|

By Leo Fasciocco -- TTD
Ticker Tape Digest presents its daily stock market report containing stocks to go long as breakout trades, quick trades, or bargain trades. We also feature stocks under Significant Accumulation that are poised to breakout.
|
Ticker Tape Digest's Daily schedule guide for TTD subscribers 1. Pre-market - check Breakout Watch List and Quick Trades. 2. Morning - (11:30 - 12 A.M.) - check breakout stocks tape and breakout chart slide show. 3. Midday (1 P.M.) check TTD Midsession Report and see market video show. 4. After close (4 P.M.) check final TTD Report for day. Trading Strategies Bullish Aggressive Investors Bullish - "Breakout Stocks" - ideally suited for bull markets and special situation stocks. Potential for large returns. (See Performance) Aggressive Investor Bullish- "Quick Trade Stocks" -ideally suited for entry into top performing issues looking for a small quick profit." (See Performance) Conservative Investors "Bargain Buy Trades for the Long Term." Ideally suited for entry into top performing big cap stocks on pullbacks within overall up trend.(See Performance) Bearish Aggressive Bearish Investors - "Breakdown Stocks" to Sell Short. Ideally suited for bear markets or market pull backs. Potential for large returns (See Performance) |
|---|
The TTD report also contains stocks to short as breakdown plays and as bargain (swing trade) shorts.
Investors should tend to try to go with a strategy that fits with the stock market's trend, unless there is a special situation play.
TTD's Breakout Stocks - Long are
most suitable for aggressive investors seeking ideal entry points into leading stocks, especially during bull markets. They can do extremely well in bull markets with gains of as much as several hundred percent. 
These stocks can also do extremely well during strong market rallies, or if they are in a industry group that is performing very well. They tend to have strong earnings outlooks and are near new-52 week, or all-time highs.
TTD Quick Trade Stocks - Long These are leading issues that have pulled back in recent days, but could move higher soon. They are most suitable for Aggressive Investors willing to trade short term. These stocks will do extremely well during market advances. They have about 74% win rate. During market rally sequences the win rate is even higher. The return is small 3% to 8% in just a few days.
TTD's Bargain Buy Trades - Long - Long Term. These are for conservative bullish Investors These long-term buys are ideally suited for entry into stocks on pull backs within overall up trend. These stocks can give a good return long-term especially during a bull market.
TTD also presents Stocks To Sell or Sell Short. These issues are suitable for aggressive investors willing to take short positions both as trades or for longer-term plays. These stocks will do very well during bear markets or market pull backs.
TTD's Bearish breakdown stocks to sell short. These issues have potential to fall sharply. They often show a technical breakdown and also some fundamental business problem such as weak earnings.
TTD's multi-media updates include a slide-show that presents charts and analysis at midsession. Some times TTD presents feature analysis on stocks and the market. TTD uses Windows Media Files. (WMV).
TTD also presents a "Breakout Watch List" that is up dated daily. This list consists of key stocks in position to breakout. A close watch of this list can put you in the stock just as it breaks out. A good idea is to study the list and be ready to move into a stock quickly as it hits its breakpoint.
TTD often suggests using stop buy orders to enter. It is very important to buy a breakout stock as close as possible to the breakpoint. The idea is to get "elbow room" if the stock should follow through to the upside. This is very important in being successful in making big money with breakout stocks.
It is also essential to have a stop loss strategy for all stocks in which positions are taken. Not every stock will work as expected. It is important for investors to "police" their portfolios and avoid getting trapped in any bad positions.
Quality rating of breakout Two key factors: 1 - Stock near all-time high in price or near a 52-week high. 2 - earnings growth current year is strong. The ideal play is a stock with an Above Average Quality Rating. The stock is near a new high and will have strong earnings. TTD's other ratings are Average and Below Average.
TTD also has special feature sections on Educational Tips on Investing.
To email Mr. Leo Fasciocco leo@tickertapedigest.com. For service, email Beverly Owen owen@tickertapedigest.com. TTD’s Tel: 1-480-926-1680.
Tuesday - March 28, 2017
TTD's Breakout Stocks
Stock Market Overview
Total Buy Breakouts so far today - 15
Quality of Breakouts - Average
Stocks Screened - 12,234
Bull side - Large list of breakout stocks with some interesting plays. Bulls can be venturesome.
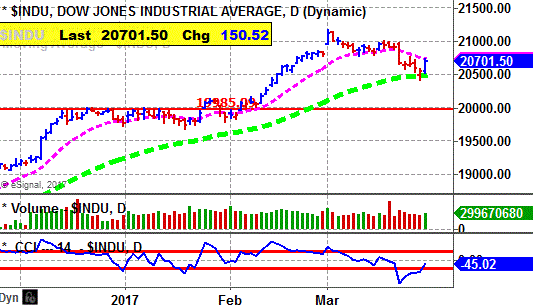
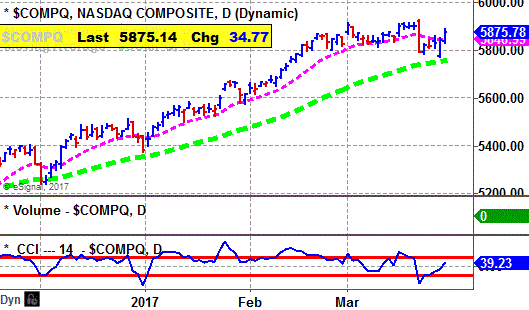
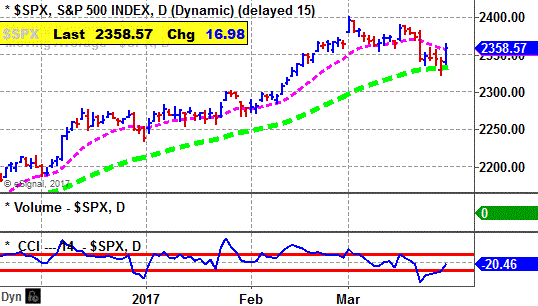
Stock market - moves across a trading range. However, the S&P 500 daily index lags.
Stock Market Momentum
|
Market (Daily) |
Market (Weekly) |
Market (Monthly) |
|
Dow - Bullish |
Dow - Bearish |
Dow - Bullish, |
|
Nasdaq - Bullish |
Nasdaq - Bearish |
Nasdaq - Bullish |
|
S&P 500 - Bullish |
S&P 500 - Bearish |
S&P 500 - Bullish |
Stock Market Charts - Daily
Ticker Tape Digest's
|
TTD's Quality Rating of Stock - COHR - ABOVE AVERAGE |
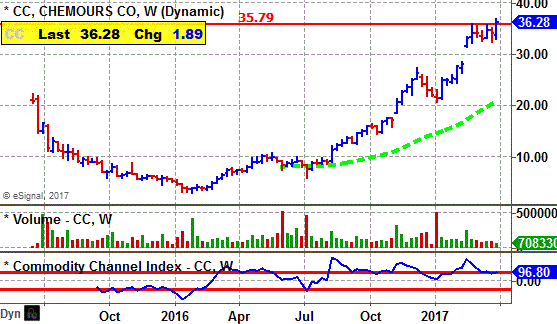
CC, based in Wilmington, Del. produces chemicals such as titanium products. Annual revenues: $5.4 billion. CC's stock moves sharply higher Tuesday and breaks out from a six-week flat base. 
The stock was highlighted on Monday as a potential breakout. It was also featured as a breakout at TTD's midsession video show on the web Tuesday.
The breakout carries CC to a new all-time high. That is bullish since there is no overhead resistance. However, the tape action late in the day was tricky.
So far today, CC is trading a heavy 5.3 million shares, triple its average daily volume is 1.9 million shares.
CC's stock drove sharply higher in the morning and cleared its breakpoint line. (see 10-minute chart).
The stock reached an in intraday peak of $36.88. It then trended sideways the rest of the day holding the bulk of its gain.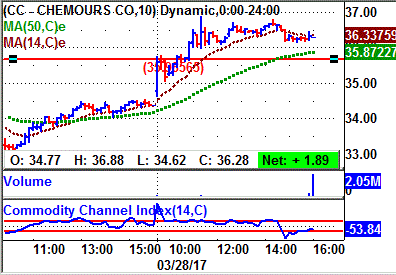
Tape Action
CC's tape action shows the recent block trades.
One can see the price for the blocks climbing from $34.39 in the prior session to as high as $36.65.
There was a key bullish trade in the morning when a block of 43,809 shares crossed the tape.
That was up from the prior block trade at $34.39 on 54,808 shares.
Then late in the day a massive block of 2,047,228 shares (duplicated) crossed the tape at $36.28.
That trade came on a down tick from the prior trade at $36.32 on 100 shares. It was also lower than a prior block trade.
So, the late tape action would indicate institutional profit taking. So, one needs to be watchful of the stock. 
Business
CC's chemical operations consists of Titanium fechnologies, fluoroproducts and chemical solutions.
TThe titanium unit produces titanium dioxide and premium white pigment. The other unit makes fluoroproducts, refrigerants and industrial fluoropolymer resins.
Charts
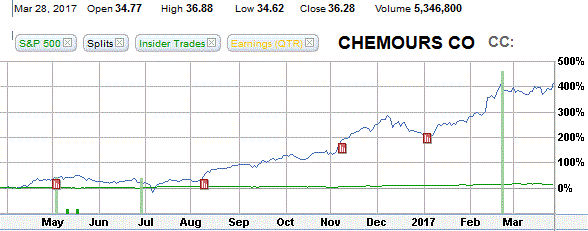
CC's 12-month performance chart shows the stock appreciating a sensational 410% versus a 17% gain for the stock market.
Insiders were buyers last year around $9.50 a share. They were also given tock options. The price was not disclosed.
The insiders have not done any selling lately.
CC's long-term chart shows the stock coming public in July of last year at $16. The stock fell hard dropping to $3.05 by early 2016
However, the rest of the year, CC drove strongly higher. It is now at an all-time high. 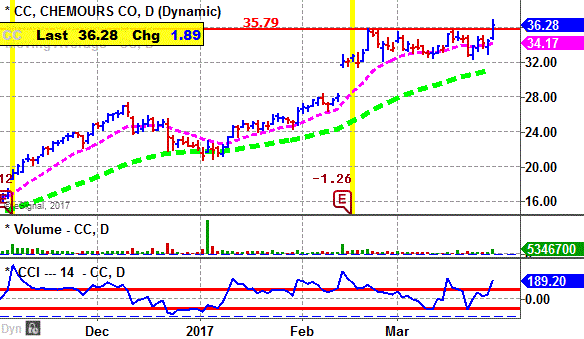
CC's daily chart shows the stock advancing from $21 in January to a peak near $35 by February.
The stock put down a tight flat base.
Tuesday, it breaks out with a nice widening of the daily spread.
That would indicate ease of price movement through the resistance zone.
The stock's CCI momentum indicator (bottom of chart) is solidly bullish.
Earnings Outlook
This year, analysts are forecasting a big 138% surge in profits to $2.43 a share from $1.02 a year before.
The stock sells with a price-earnings ratio of 14. TTD sees that as attractive for value investors.
Going out to 2018, the Street predicts a 13% increase in profits to $2.75 a share from the anticipated $2.43 this year.
The next two quarters should show very strong earnings gains.
Net for the first quarter should surge 667% to 46 cents a share from 6 cents the year before.
For the second quarter, net is expected to leap 148% to 67 cents a share from 27 cents a year ago.
Strategy Opinion: TTD is targeting CC for a move to $44 within the next few months or sooner.
A protective stop can be placed near $32.
TTD rates CC a good intermediate-term play provided earnings meet expectations.
Suitability: Aggressive Bulls.
TTD's special research of CC's Stock's Prior Performance after a Breakout:
TTD's research shows that recently (see table) CC has scored some sensational gains off its breakouts.
CC has moved higher 5 out of the past 7 earnings reports where there was a significant change.
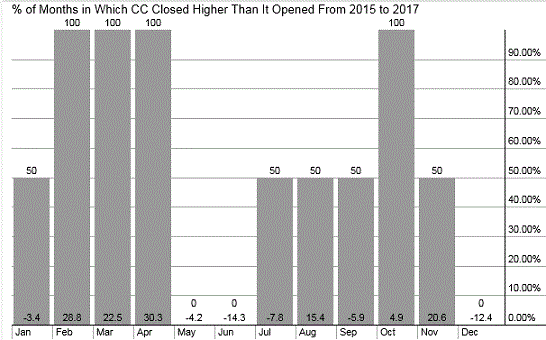
CC's Seasonal chart shows the stock tends to do well in March and April.
Stock's Prior Performance After A Breakout
|
Stock's % Change from Breakout to peak - prior to cut below 50-day M/A. |
Date of Breakout |
Break point Price |
Stocks Price Peak after Breakout - prior to cut below 50-day M/A |
Date Trade Closed |
|
30% |
2/10/2017 | 27.26 | 35.60 | Still in play |
|
63% |
11/7/2016 | 16.44 | 26.96 | 12/8/2016 |
|
274% |
8/8/2016 | 9.83 | 26.96 | 12/8/2016 |
(In actual trading, entry and exit points could vary depending on broker execution.
Also, ideal are breakouts to a new 52-week high or better, perhaps all-time highs.)
Stock's Long-term Chart
Stock's Performance Chart with Quarterly Earnings Markers vs. S&P 500
Insider Buying in Green - Insider Selling in Red
Stock's Monthly Seasonal Performance Chart - Past 5 Years
Showing % Months UP and % Change
Charts of Selected Breakout Stocks
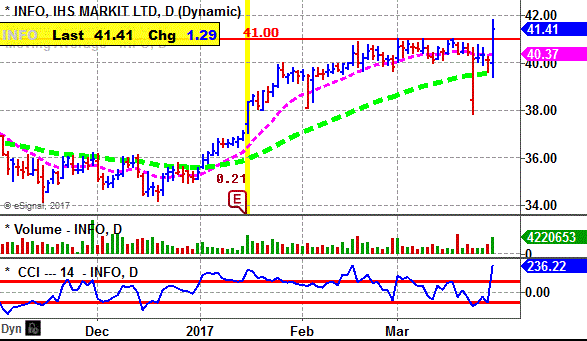
| TTD's Quality Rating of Stock - INFO - ABOVE AVERAGE |
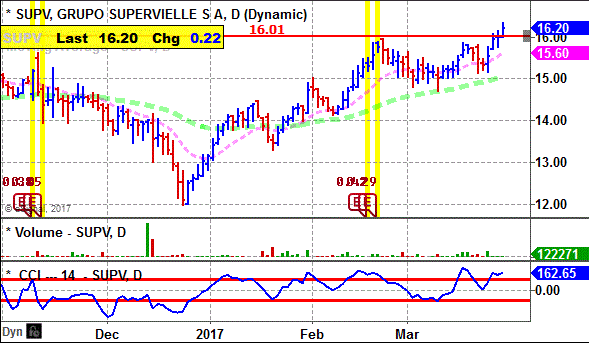
| TTD's Quality Rating of Stock - SUPV - ABOVE AVERAGE |
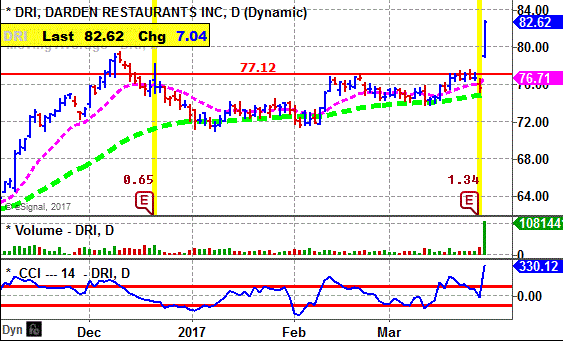
| TTD's Quality Rating of Stock - DRI - AVERAGE |
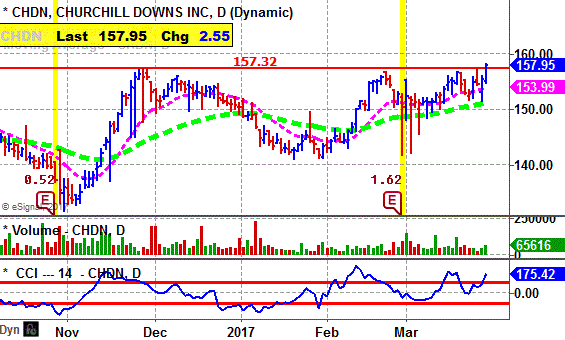
| TTD's Quality Rating of Stock - CHDN - AVERAGE |

Ticker Tape Digest’s Daily List of “Stocks To Sell or Sell Short” ranks stocks well timed to be sold immediately based on daily trading. The list can be used as an alert to reduce current long-term positions.
Shorts from tape action so far today - 4
Stocks Screened - 12,234
Long-Term Environment for bears: Unfavorable.
Bear Side - Small list of breakdown stocks Tuesday as stock market drives higher. Bears be conservative.
TTD's short from Monday was Synchronoss Technologies (SNCR) at $24.59. It fell to $24.12 Tuesday and is working well for bears.
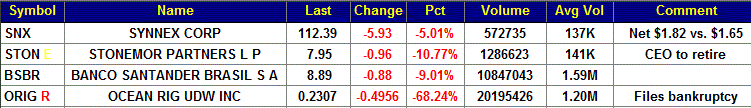
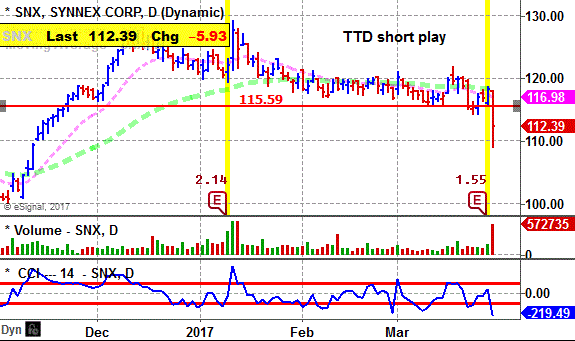
SNX, based in Fremont, Ca., provides a range of distribution, logistics and integration services for the tech industry. Annual revenues: $14.1 billion. SNX's stock falls sharply Tuesday and undercuts key technical support. TTD sees more on the downside. 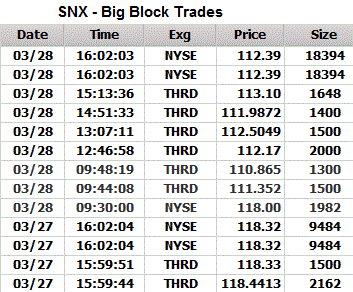
TTD highlighted SNX as a short at our midsession video show on the Web Tuesday.
So far today, SNX is trading 574,247 shares, four times its average daily volume of 137,000 shares.
SNX reported net for the fiscal second quarter ending in February of $1.82 a share. That topped the Street estimate by 17 cents a share.
The company forecast fiscal third quarter in line with Street estimates.
Nevertheless, SNX came under selling pressure.
Tape Action
SYNX's tape action shows the recent block trades.
One can see the price for the blocks falling from $118.44 in the prior session to as low as $110.86 Tuesday morning.
A key bearish trade came when a block of 1,500 shares crossed the tape in the morning at $111.35.
That was down from the prior block at $118 on 1,982 shares.
Business
The company distributes peripherals, information technology systems, including data center server and storage solutions, system components, software, networking/communications/security equipment.
SYNX's also offers a portfolio of solutions and end-to-end business services focused on customer engagement strategy, process optimization and technology innovation.
Earnings:
This fiscal year ending in November analysts are forecasting a 10% increase in net to $7.77 a share from the $7.04 a share the year before.
Charts:
SNX's daily chart shows the stock cut below key technical support with big volume.
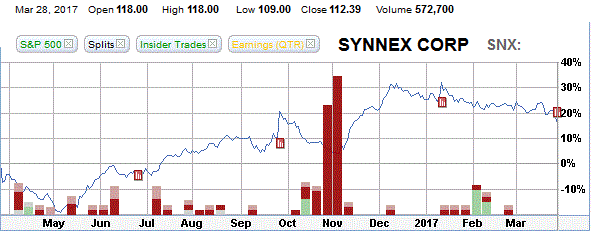
The 12-month performance chart shows the stock gaining 18% versus a gain of 16% for the stock market.
Insiders have been recent buyers using stock options at $27 to $29 a share. They were sellers around $117 to $119 this year.
Strategy Opinion: TTD is targeting SNX for a decline to $94 within the next few months or sooner. A protective stop buy can be placed near $117.
Suitability: Average Bears.
| TTD's Quality Rating of Stock - SNX - AVERAGE |
Stock Performance Chart with Quarterly Earnings Markers vs. S&P 500
Insider Buying in Green - Insider Selling in Red
TTD columnist Leo Fasciocco has covered the stock market for over 30 years. His articles appear in many publications. He is also a speaker at the Intershow conferences. He has been on television and radio. He is author of many educational articles about stock investing and the book “Guide To High-Performance Investing.”

For information to subscribe to the Ticker Tape Digest Services call: Beverly Owen at 1-480-926-1680. Distributed by Corona Publishing Enterprises. Ticker Tape Digest Inc. P.O. Box 2044 Chandler, Az. 85244-2044. TTD “Professional Report” is available on the World Wide Web: $100 per month. Password needed. “TTD Professional“ Faxed is $200 per month. The TTD Daily Report is $39.95. Credit cards accepted.
(The information contained has been prepared from data deemed reliable but there is no guarantee of complete accuracy. Ticker Tape Digest Inc. is not affiliated with any broker, dealer or investment advisor. Nothing in this publication constitutes an offer, recommendation or solicitation to buy or sell any securities. Further research is advised. This report is copyrighted and no redistribution is permitted with out permission.)