![]()
|
|
|
Weekly - Bullish Conservative Investors - Go To TTD Long-Term Plays - Monday, Aprl 1, 2019 |
|
|
Go to Video Show - "How to Make Money With Breakout Stocks |
|---|

By Leo Fasciocco -- TTD
Ticker Tape Digest presents its daily stock market report containing stocks to go long as Breakout Trades, Quick Trades, or Bargain Accumulation Trades.
We also feature stocks under Significant Accumulation that are poised to breakout.
|
Ticker Tape Digest's Daily schedule guide for TTD subscribers 1. Pre-market - check Breakout Watch List and Quick Trades. 2. Morning - (11:30 - 12 A.M.) - check breakout stocks tape and breakout chart slide show. 3. Midday (1 P.M.) check TTD Midsession Report and see market video show. 4. After close (4 P.M.) check final TTD Report for day. Trading Strategies Bullish Aggressive Investors Bullish - "Breakout Stocks" - ideally suited for bull markets and special situation stocks. Potential for large returns. (See Performance) Aggressive Investor Bullish- "Quick Trade Stocks" -ideally suited for entry into top performing issues looking for a small quick profit." (See Performance) Conservative Investors "Bargain Buy Trades for the Long Term." Ideally suited for entry into top performing big cap stocks on pullbacks within overall up trend.(See Performance) Bearish Aggressive Bearish Investors - "Breakdown Stocks" to Sell Short. Ideally suited for bear markets or market pull backs. Potential for large returns (See Performance) |
|---|
The TTD report also contains stocks to short as breakdown plays and as bargain (swing trade) shorts.
Investors should tend to try to go with a strategy that fits with the stock market's trend, unless there is a special situation play.
TTD's Breakout Stocks - Long are
most suitable for aggressive investors seeking ideal entry points into leading stocks, especially during bull markets. They can do extremely well in bull markets with gains of as much as several hundred percent. 
These stocks can also do extremely well during strong market rallies, or if they are in a industry group that is performing very well. They tend to have strong earnings outlooks and are near new-52 week, or all-time highs.
TTD Quick Trade Stocks - Long These are leading issues that have pulled back in recent days, but could move higher soon. They are most suitable for Aggressive Investors willing to trade short term. These stocks will do extremely well during market advances. They have about 74% win rate. During market rally sequences the win rate is even higher. The return is small 3% to 8% in just a few days.
TTD's Bargain Buy Trades - Long - Long Term. These are for conservative bullish Investors These long-term buys are ideally suited for entry into stocks on pull backs within overall up trend. These stocks can give a good return long-term especially during a bull market.
TTD also presents Stocks To Sell or Sell Short. These issues are suitable for aggressive investors willing to take short positions both as trades or for longer-term plays. These stocks will do very well during bear markets or market pull backs.
TTD's Bearish breakdown stocks to sell short. These issues have potential to fall sharply. They often show a technical breakdown and also some fundamental business problem such as weak earnings.
TTD's multi-media updates include a slide-show that presents charts and analysis at midsession. Some times TTD presents feature analysis on stocks and the market. TTD uses Windows Media Files. (WMV).
TTD also presents a "Breakout Watch List" that is up dated daily. This list consists of key stocks in position to breakout. A close watch of this list can put you in the stock just as it breaks out. A good idea is to study the list and be ready to move into a stock quickly as it hits its breakpoint.
TTD often suggests using stop buy orders to enter. It is very important to buy a breakout stock as close as possible to the breakpoint. The idea is to get "elbow room" if the stock should follow through to the upside. This is very important in being successful in making big money with breakout stocks.
It is also essential to have a stop loss strategy for all stocks in which positions are taken. Not every stock will work as expected. It is important for investors to "police" their portfolios and avoid getting trapped in any bad positions.
Quality rating of breakout Two key factors: 1 - Stock near all-time high in price or near a 52-week high. 2 - earnings growth current year is strong. The ideal play is a stock with an Above Average Quality Rating. The stock is near a new high and will have strong earnings. TTD's other ratings are Average and Below Average.
TTD also has special feature sections on Educational Tips on Investing.
To email Mr. Leo Fasciocco leo@tickertapedigest.com.
For service, email Beverly Owen owen@tickertapedigest.com. TTDÆs Tel: 1-480-926-1680.
Wednesday - April 3, 2019
TTD's Breakout Stocks
Stock Market Overview
Total Buy Breakouts so far today - 12
Quality of Breakouts - Above Average
Stocks Screened - 12,234
Bull side - Large list of breakouts with some good looking plays.
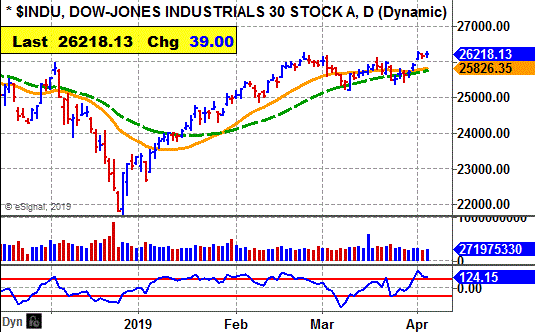
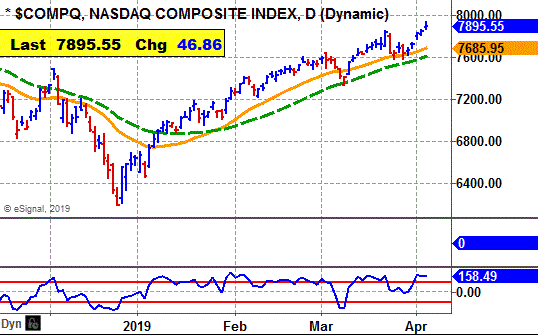
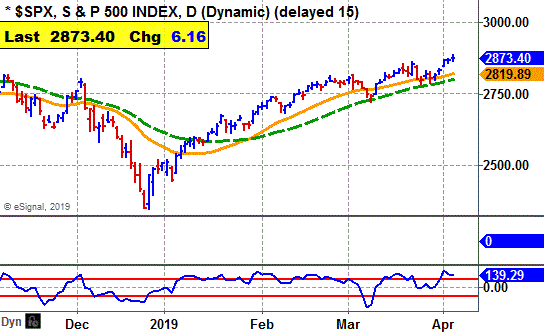
Stock market - Market averages are bullish in all time sectors.
Comment - Stock market now getting close to prior peak made in August of last year. Upside move still in place.
See Latest Earnings Reports - A company that tops the Street's highest earnings estimate has potential to go higher. Earnings beats for Wednesday - LNDC, AYI and SIG.
Stock Market Momentum
(Daily is based on a moving average)
|
Market (Daily) |
Market (Weekly) |
Market (Monthly) |
|
Dow - Bullish |
Dow - Bullish |
Dow - Bullish |
|
Nasdaq - Bullish |
Nasdaq - Bullish |
Nasdaq - Bullish |
|
S&P 500 - Bullish |
S&P 500 - Bullish |
S&P 500 - Bullish |
 Ticker Tape Digest's
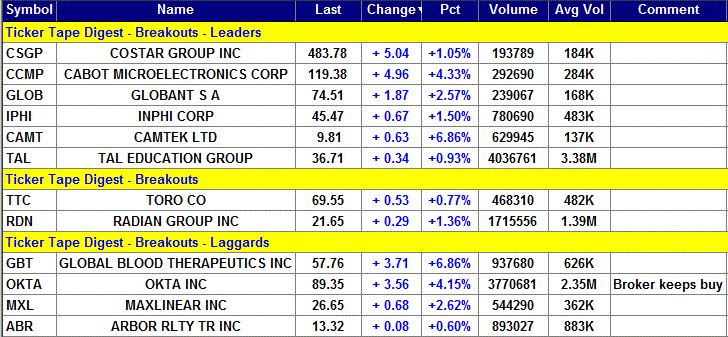
|
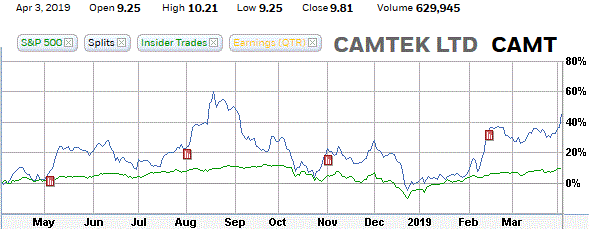
TTD's Quality Rating of Stock - CAMT - ABOVE AVERAGE |
CAMT, based in Israel, makes metrology and inspection equipment and a provides software solutions. Annual revenues: $123 million. CAMT's stock breaks out from an 8-week flat base. The stock is close to making a new all-time high. 
TTD sees more on the upside.
So far today, CAMT is trading a heavy 631,054 shares, close to five times its average daily volume of 137,000 shares.
CAMT's stock breakout in the morning. It climbed to an intraday high of $10.21 around noon. 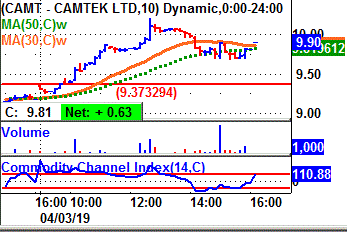
The stock then pulled back in the afternoon, but still held above its breakpoint line.
Tape Action
CAMT's tape action shows the recent block trades.
One can see the price of the blocks climbing from $9.20 in the prior session to as high as $10.17 at midday.
A key bullish trade came in the morning when a block of 5,000 shares crossed the tape at $9.70.
That was up from the prior block at $9.20 on 5,144 shares the prior session. 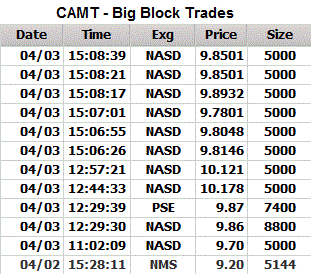
Business
CAMT serves the advanced Packaging, Memory, complementary Metal Oxide Semiconductor Image Sensors, Micro Electro Mechanical Sensor, Radio Frequency (RF) and other segments in the mid end of the semiconductors industry.
The company has seven offices around the world and provides tailor-made solutions for customers.
Some of CAMT's subsidiaries are: Camtek Europe SA, Camtek Korea Ltd, Camtek South East Asia Pte Ltd, Camtek USA Inc, and Sela - Semiconductor Engineering Laboratories USA Inc.
Charts
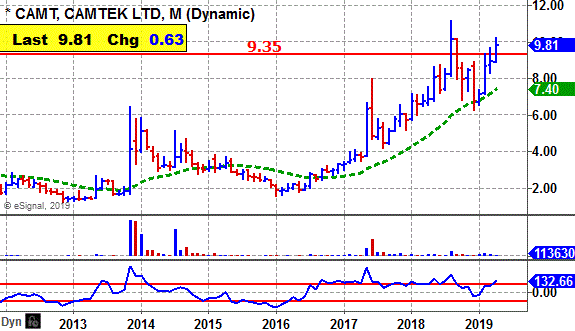
CAMT's 12-month performance chart shows the stock up 48% versus a 10% gain for the stock market.
Insider activity is not available.
CAMT's long-term chart shows the stock surging from $2 to $6.43 in 2013. However, it fell back to $1.58 by early 2016.
Since then, though, CAMT has been climbing steadily. It is within range to challenge its recent peak at $11.11 set late last year. 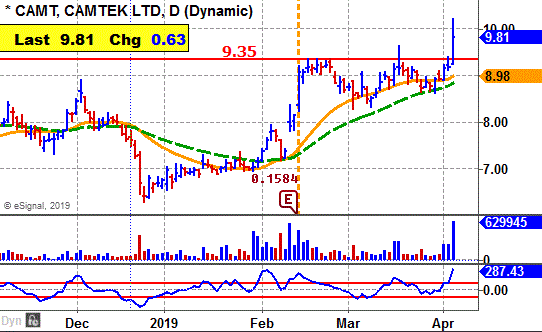
CAMT's daily chart shows a classic breakout from a flat base.
The move comes with expanding volume and a widening of the daily spread.
One can see the stock had a strong move up in February after reporting earnings.
The stock's CCI momentum indicator (bottom of chart) is strongly bullish.
Earnings Outlook
This year, analysts are forecasting a 25% jump in net to 71 cents a share from 57 cents the year before.
The stock sells with a price-earnings ratio of just 13. TTD sees that as attractive for value investors.
Going out to 2020, the Street is predicting an 18% increase in net to 84 cents a share from the anticipated 71 cents this year.
Quarterly earnings will be strong.
Net for the upcoming first quarter should leap 50% to 18 cents a share from the 12 cents the year before.
Two analysts follow the stock.
Then in the second quarter they expect net to climb 38% to 18 cents a share from the 13 cents the year before.
Strategy Opinion: TTD is targeting CAMT for a move to $13 within the next few months, or sooner.
A protective stop can be placed near $8.80.
Intermediate-Term Rating: Above average.
Suitability: Aggressive Bulls.
TTD's special research of Stock's Prior Performance:
Probability - Breakout Success - Very Bullish - CAMT scored some big gains off some of its recent breakouts. The stock is in a long-term up trend.
Probability - Earnings Response - Very Bullish - CAMT rose 6 times after the past 8 earnings reports when there was a significant change in price.
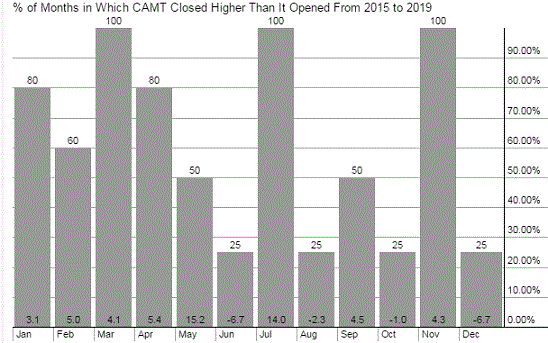
Probability: Seasonal Success - Extremely Bullish. - CAMT averaged a gain of 5.4% in April and a gain of 15.2% in May the past several years.
Stock's Prior Performance After A Breakout
|
Stock's % Change from Breakout to peak - prior to cut below 50-day M/A. |
Date of Breakout |
Break point Price |
Stocks Price Peak after Breakout - prior to cut below 50-day M/A |
Date Trade Closed |
|
23% |
8/6/2018 |
8.76 |
10.78 |
8/20/2018 |
|
21% |
5/3/2018 |
7.12 |
8.63 |
6/12/2018 |
|
86% |
5/9/2017 |
4.11 |
7.67 |
6/6/2017 |
|
33% |
7/15/2016 |
2.32 |
3.09 |
10/11/2016 |
(In actual trading, entry and exit points could vary depending on broker execution.
Also, ideal are breakouts to a new 52-week high or better, perhaps all-time highs.)
Stock's Long-term Chart
Stock's Performance Chart with Quarterly Earnings Markers vs. S&P 500
Insider Buying in Green - Insider Selling in Red
Stock's Monthly Seasonal Performance Chart - Past 5 Years
Showing % Months UP and % Change
| TTD's Breakout Profile Rating Camtek Ltd. (CAMT) |
| TTD Check List | Bullish | Bearish | Neutral |
| Near 52-week High | YES | ||
| Volume | YES | ||
| Tick Volume | YES | ||
| Price Trend - Daily | YES | ||
| Price Trend - Long Term | YES | ||
| Price Daily Spread | YES | ||
| Base Structure | YES | ||
| Base - A-D | YES | ||
| Earnings-Quarterly | YES | ||
| Earnings-Long Term | YES | ||
| Earnings Outlook | YES | ||
| Industry Group | YES | ||
| Prior Breakout Success | YES | ||
| Fund Sponsorship | YES | ||
| Total Score | 14 | 0 | 0 |
Charts of Selected Breakout Stocks
|
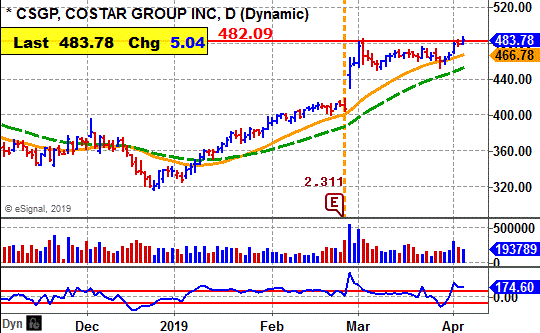
TTD's Quality Rating of Stock - CSGP - ABOVE AVERAGE |
|
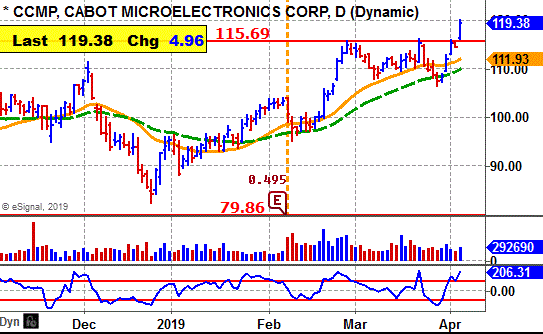
TTD's Quality Rating of Stock - CCMP - ABOVE AVERAGE |
|
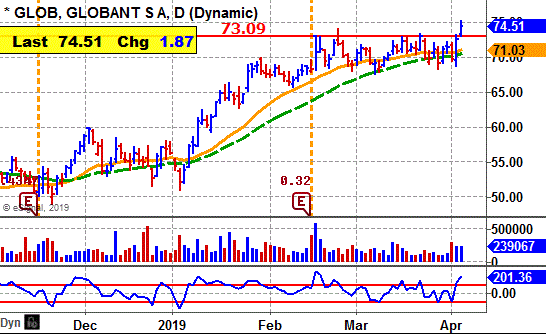
TTD's Quality Rating of Stock - GLOB - ABOVE AVERAGE |
|
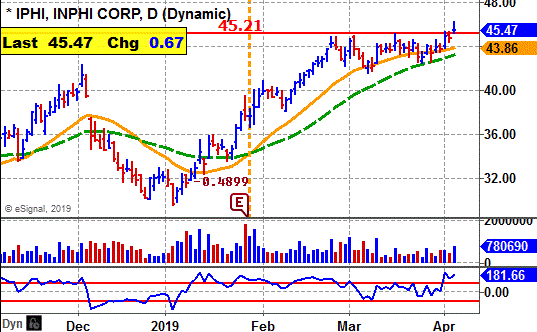
TTD's Quality Rating of Stock - IPHI - ABOVE AVERAGE |

Ticker Tape DigestÆs Daily List of ōStocks To Sell or Sell Shortö ranks stocks well timed to be sold immediately based on daily trading. The list can be used as an alert to reduce current long-term positions.
Shorts from tape action so far today - 3
Stocks Screened - 12,234
Long-Term Environment for bears: Unfavorable.
Bear Side - Small list of shorts. Bears be conservative.
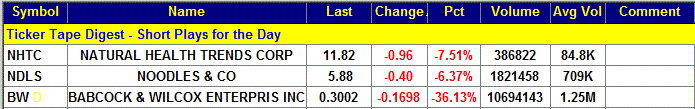
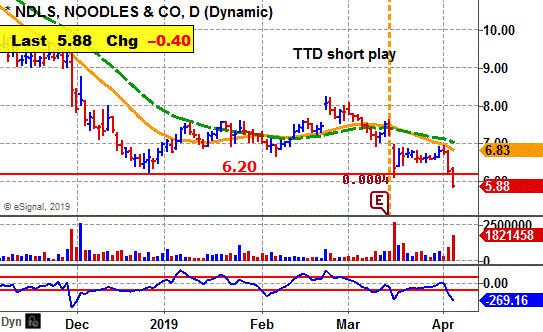
NDLS, based in Broomfield, Co., operates fast casual restaurants. Annual revenues: $458 million. NDLS's stock declines sharply Wednesday and undercuts key technical support. 
So far today, NDLS is trading a heavy 1.8 million shares, more than double its average daily volume of 709,000 shares.
TTD sees more on the downside.
TTD highlighted NDLS as a short at our midsession video show on the Web Wednesday.
NDLS fell in the morning and undercut key technical support. By midday, the stock touched $5.88. 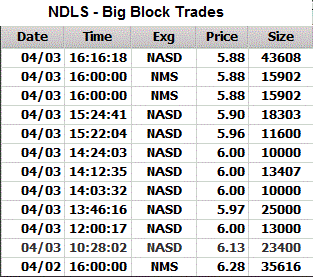
It tried to rally, but then fade in the final hour to close near its low for session.
Tape Action
NDLS's tape action shows the recent block trades.
One can see the price for the blocks falling from $6.28 in the prior session to as low as $5.88 by the end of the day.
A key bearish trade came in the morning when a block of 23,400 shares crossed the tape at $6.13.
That was down from the prior block at $6.28 on 35,616 shares late on Tuesday.
Business
NDLS's menu includes a range of cooked-to-order dishes, including noodles and pasta, soups, salads, sandwiches and appetizers.
The company has 490 restaurants, including 420 Company-owned and 70 franchised locations. They are in 40 states and one is in Canada.
Earnings:
This year, analysts are forecasting a 500% surge in net to 12 cents a share from 2 cents the year before.
The stock sells with a price-earnings ratio of 49.
For the first quarter, analysts predict a loss of 5 cents a share compared with a loss of 4 cents the year before.
The company tends to meet or come in below Street estimates.
Charts:
NDLS's daily chart shows the stock trending lower and then moving sideways. Wednesday it cuts below support with heavy volume. The move resumes a down trend. Back in 2013, NDLS was as high as $49.75.
NDLS' 12-month performance chart shows the stock down 18% versus a 10% gain for the stock market.
Insiders were steady and heavy sellers late in 2018 at $8.90. They have not done any buying this year.
Strategy Opinion: TTD is targeting NDLS for a decline 4.50 within the next few months. A protective stop buy can be placed near $6.50.
Suitability: Aggressive Bears.
TTD's probability research of Prior Performance:
Probability - Earnings Response - Bearish. - NDLS declined after the past several earnings reports.
Probability: Seasonal Activity - Extremely Bearish. - NDLS averaged a decline of 1.4% in April and a decline of 10.3% in May the past several years.
|
TTD's Quality Rating of Stock - NDLS - BELOW AVERAGE |
Stock's Performance Chart with Quarterly Earnings Markers vs. S&P 500
Insider Buying in Green - Insider Selling in Red

TTD columnist Leo Fasciocco has covered the stock market for over 30 years. His articles appear in many publications. He has also been a speaker at the Money Show conferences. He has been on television and radio. He is author of many educational articles about stock investing and the book ōGuide To High-Performance Investing.ö

For information to subscribe to the Ticker Tape Digest Services call: Beverly Owen at 1-480-878-8381 or 480-704-3331
Distributed by Corona Publishing Enterprises. TickerTape Digest Inc. 1220 W. Sherri, Gilbert, Az. 85233.
TTD ōProfessional Reportö is available on the Web: $100 per month. Password needed. Published daily - around 20 times a month.
TTD Pro Report includes a Morning chart slide show of breakout stocks, a Midsession video-audio show with commentary on breakout stocks and shorts and a Final end of day overall report on breakout stocks for the session, short plays and accumulation plays. There are other features too such as Quick Trades and Long-term Plays.
TTD Daily Report is $39. It covers a Morning slide show of charts of stocks breaking out and a TTD end of day print report covering breakout stocks and shorts.
Credit cards accepted. Payable to Corona Publishing Enterprises.
(The information contained has been prepared from data deemed reliable but there is no guarantee of complete accuracy. Ticker Tape Digest Inc. is not affiliated with any broker, dealer or investment advisor. Nothing in this publication constitutes an offer, recommendation or solicitation to buy or sell any securities. Further research is advised. This report is copyrighted and no redistribution is permitted with out permission.)