![]()
|
|
|
Weekly - Bullish Conservative Investors - Go To TTD Long-Term Plays - Monday, April 2,2018 |
|
|
Go to Video Show - "How to Make Money With Breakout Stocks |
|---|

By Leo Fasciocco -- TTD
Ticker Tape Digest presents its daily stock market report containing stocks to go long as Breakout Trades, Quick Trades, or Bargain Accumulation Trades.
We also feature stocks under Significant Accumulation that are poised to breakout.
|
Ticker Tape Digest's Daily schedule guide for TTD subscribers 1. Pre-market - check Breakout Watch List and Quick Trades. 2. Morning - (11:30 - 12 A.M.) - check breakout stocks tape and breakout chart slide show. 3. Midday (1 P.M.) check TTD Midsession Report and see market video show. 4. After close (4 P.M.) check final TTD Report for day. Trading Strategies Bullish Aggressive Investors Bullish - "Breakout Stocks" - ideally suited for bull markets and special situation stocks. Potential for large returns. (See Performance) Aggressive Investor Bullish- "Quick Trade Stocks" -ideally suited for entry into top performing issues looking for a small quick profit." (See Performance) Conservative Investors "Bargain Buy Trades for the Long Term." Ideally suited for entry into top performing big cap stocks on pullbacks within overall up trend.(See Performance) Bearish Aggressive Bearish Investors - "Breakdown Stocks" to Sell Short. Ideally suited for bear markets or market pull backs. Potential for large returns (See Performance) |
|---|
The TTD report also contains stocks to short as breakdown plays and as bargain (swing trade) shorts.
Investors should tend to try to go with a strategy that fits with the stock market's trend, unless there is a special situation play.
TTD's Breakout Stocks - Long are
most suitable for aggressive investors seeking ideal entry points into leading stocks, especially during bull markets. They can do extremely well in bull markets with gains of as much as several hundred percent. 
These stocks can also do extremely well during strong market rallies, or if they are in a industry group that is performing very well. They tend to have strong earnings outlooks and are near new-52 week, or all-time highs.
TTD Quick Trade Stocks - Long These are leading issues that have pulled back in recent days, but could move higher soon. They are most suitable for Aggressive Investors willing to trade short term. These stocks will do extremely well during market advances. They have about 74% win rate. During market rally sequences the win rate is even higher. The return is small 3% to 8% in just a few days.
TTD's Bargain Buy Trades - Long - Long Term. These are for conservative bullish Investors These long-term buys are ideally suited for entry into stocks on pull backs within overall up trend. These stocks can give a good return long-term especially during a bull market.
TTD also presents Stocks To Sell or Sell Short. These issues are suitable for aggressive investors willing to take short positions both as trades or for longer-term plays. These stocks will do very well during bear markets or market pull backs.
TTD's Bearish breakdown stocks to sell short. These issues have potential to fall sharply. They often show a technical breakdown and also some fundamental business problem such as weak earnings.
TTD's multi-media updates include a slide-show that presents charts and analysis at midsession. Some times TTD presents feature analysis on stocks and the market. TTD uses Windows Media Files. (WMV).
TTD also presents a "Breakout Watch List" that is up dated daily. This list consists of key stocks in position to breakout. A close watch of this list can put you in the stock just as it breaks out. A good idea is to study the list and be ready to move into a stock quickly as it hits its breakpoint.
TTD often suggests using stop buy orders to enter. It is very important to buy a breakout stock as close as possible to the breakpoint. The idea is to get "elbow room" if the stock should follow through to the upside. This is very important in being successful in making big money with breakout stocks.
It is also essential to have a stop loss strategy for all stocks in which positions are taken. Not every stock will work as expected. It is important for investors to "police" their portfolios and avoid getting trapped in any bad positions.
Quality rating of breakout Two key factors: 1 - Stock near all-time high in price or near a 52-week high. 2 - earnings growth current year is strong. The ideal play is a stock with an Above Average Quality Rating. The stock is near a new high and will have strong earnings. TTD's other ratings are Average and Below Average.
TTD also has special feature sections on Educational Tips on Investing.
To email Mr. Leo Fasciocco leo@tickertapedigest.com.
For service, email Beverly Owen owen@tickertapedigest.com. TTD’s Tel: 1-480-926-1680.
Wednesday - April 4, 2018
TTD's Breakout Stocks
Stock Market Overview
Total Buy Breakouts so far today - 10
Quality of Breakouts - Above Average.
Stocks Screened - 12,234
Bull side - Breakout list has some interesting plays for aggressive bulls.
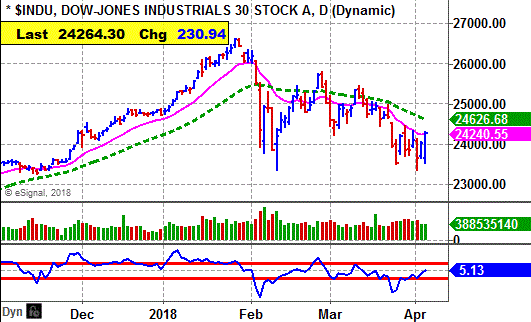
Stock market - Bearish. The major averages remain bearish both daily and weekly, except the daily Dow which just edges above its 15-day M/A. The overall trend does remain down. It may take the market time to form a bottom. So, Bulls remain conservative.
Stock Market Momentum
(Daily is based on a moving average)
|
Market (Daily) |
Market (Weekly) |
Market (Monthly) |
|
Dow - Bullish |
Dow - Bearish |
Dow - Bullish, |
|
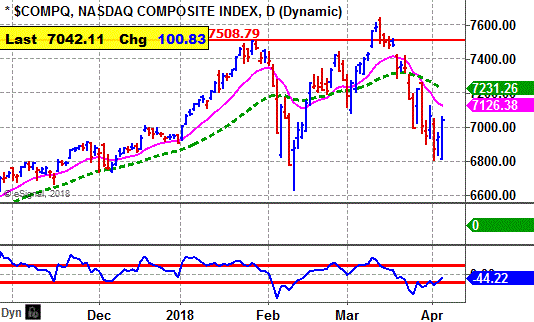
Nasdaq - Bearish |
Nasdaq - Bearish |
Nasdaq - Bullish |
|
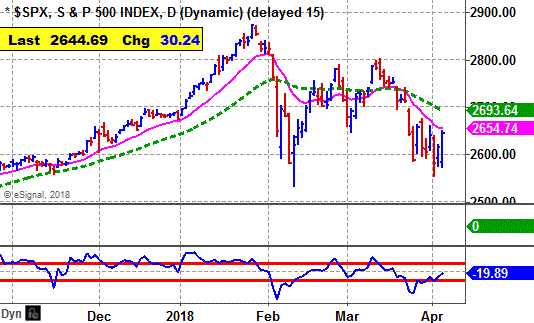
S&P 500 - Bearish |
S&P 500 - Bearish |
S&P 500 - Bullish |
Ticker Tape Digest's
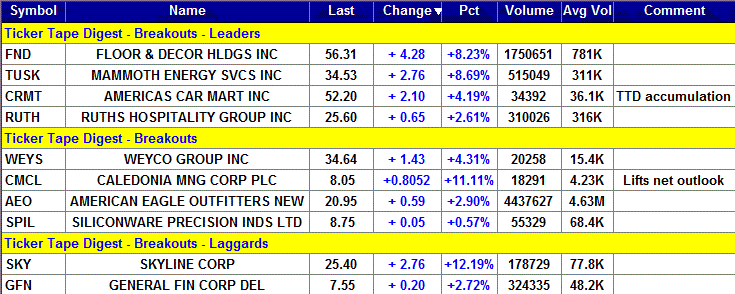
|
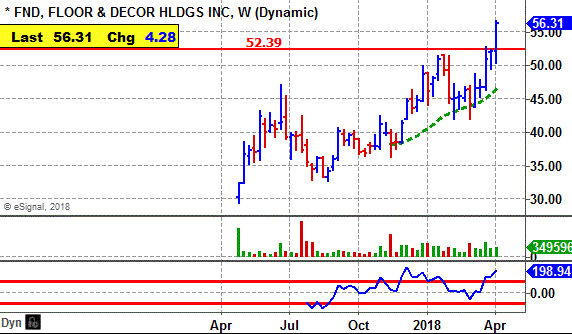
TTD's Quality Rating of Stock - FND - ABOVE AVERAGE |
FND, based in Smyrna, Ga., sells surface flooring items such as tile and also marble and glass products. Annual revenues: $1.1 billion. FND's stock drives higher Wednesday and breaks out from a 12-week cup-and-handle base. 
So far today, FND is trading a heavy 1.8 million shares, double its average daily volume of 781,000 shares.
TTD highlighted FND as a breakout at our midsession video show on the Web Wednesday.
FND's stock drove higher in the morning and cleared its breakpoint line.
The stock continued to work higher through the day. It closed near its high for the day. That is bullish. 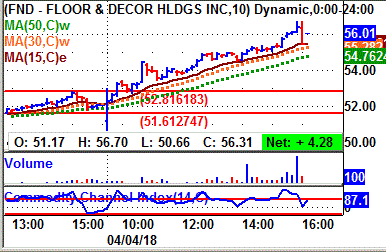
Tape Action
FND's tape action shows the recent block trades.
One can see the price for the blocks climbing from $51.17 in the morning to as high as $56,41 Wednesday.
A key bullish trade came in the morning when a block of 6,500 shares crossed the tape in the early afternoon at $54.88.
That was up sharply from the prior block at $51.17 on 5,193 shares.
Near the close a block of 43,633 shares (duplicated) crossed the tape at $56.31. 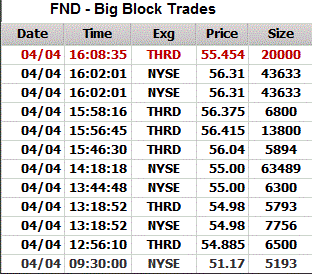
That trade came on a down tick from the prior trade at $56.38 on 100 shares.
So, there appeared to be some institutional selling.
Business
FND sells tile, stone, wood, marble, glass and decoratives.
The company has 72 stores in 17 states .
FND sells to professional installers and commercial businesses and do-it-yourself customers.
The company engages their customers both through trained store associates and designers who can assist in narrowing choices.
Charts
FND's 12-month performance chart shows the stock surging 77% versus a 14% gain for the stock market.
FND's long-term chart shows the stock coming public last year in April - a year ago - at $30.25. The stock has since more than doubled getting to $56.31. 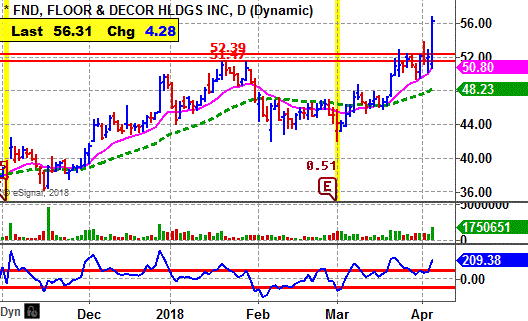
FND's daily chart shows the stock climbing from $36 in November to a peak near $52 by late January.
The stock then formed a cup-and-handle base.
It had a breakout a few sessions ago, but then faded back.
The breakout Wednesday clears all upside resistance with a widening of the daily spread and expanding volume.
The stock's CCI momentum indicator is strongly bullish.
Earnings Outlook:
This year, analysts are forecasting a 43% surge in net to 99 cents a share from the 69 cents the year before.
The stock has a price-earnings ratio of 56. TTD sees that as okay given the strong earnings outlook.
Looking out to 2019, the Street is predicting a 29% gain in net to $1.28 a share from the anticipated 99 cents this year.
Quarterly net will be strong.
Net for the first quarter is expected to leap 77% to 23 cents a share from the 13 cents last year.
The company tends to slightly exceed consensus estimates.
Going out to the second quarter, net is expected to be up 45% to 29 cents a share from the 20 cents the year before.
Strategy Opinion: TTD is targeting FND for a move to $64 off this breakout. A protective stop can be placed near $52
Intermediate-Term Rating: Average.
Suitability: Average Bulls.
TTD's special research of Stock's Prior Performance:
Probability - Breakout Success - Bullish - FND has tended to score some good gains off its recent breakouts.
Probability - Earnings Response - Neutral. FND rose 2 times after the past 4 earnings reports when there was a significant change.
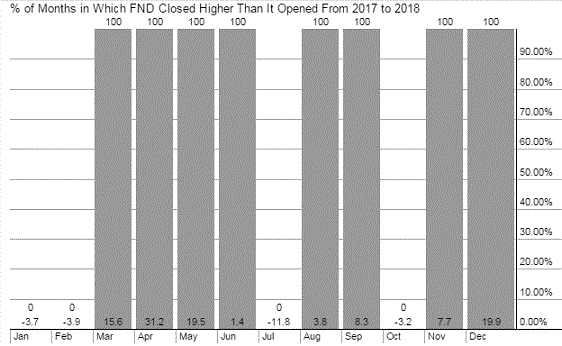
Probability: Seasonal Success - Extremely Bullish. FND soared an average of 31.2% in April and 19.4% in May in prior years.
Stock's Prior Performance After A Breakout
|
Stock's % Change from Breakout to peak - prior to cut below 50-day M/A. |
Date of Breakout |
Break point Price |
Stocks Price Peak after Breakout - prior to cut below 50-day M/A |
Date Trade Closed |
|
25% |
12/1/2017 |
40.74 |
51 |
1/19/2018 |
|
15% |
5/26/2017 |
38.58 |
44.53 |
6/21/2017 |
(In actual trading, entry and exit points could vary depending on broker execution.
Also, ideal are breakouts to a new 52-week high or better, perhaps all-time highs.)
Stock's Long-term Chart
Stock's Performance Chart with Quarterly Earnings Markers vs. S&P 500
Insider Buying in Green - Insider Selling in Red

Stock's Monthly Seasonal Performance Chart - Past 5 Years
Showing % Months UP and % Change
| TTD's Breakout Profile Rating Floor & Decor Holdings Inc. (FND) |
| TTD Check List | Bullish | Bearish | Neutral |
| Near 52-week High | YES | ||
| Volume | YES | ||
| Tick Volume | YES | ||
| Price Trend - Daily | YES | ||
| Price Trend - Long Term | YES | ||
| Price Daily Spread | YES | ||
| Base Structure | YES | ||
| Base - A-D | YES | ||
| Earnings-Quarterly | YES | ||
| Earnings-Long Term | YES | ||
| Earnings Outlook | YES | ||
| Industry Group | YES | ||
| Prior Breakout Success | YES | ||
| Fund Sponsorship | YES | ||
| Total Score | 14 | 0 | 0 |
Charts of Selected Breakout Stocks
|
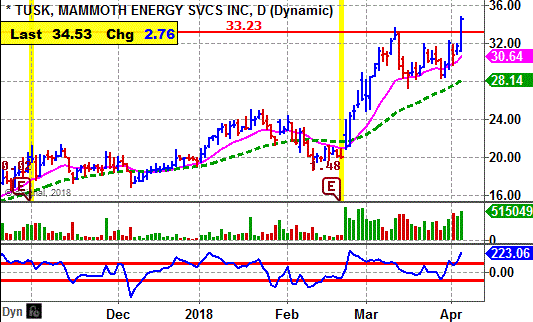
TTD's Quality Rating of Stock - TUSK - ABOVE AVERAGE |
|
TTD's Quality Rating of Stock - CRMT - ABOVE AVERAGE |

|
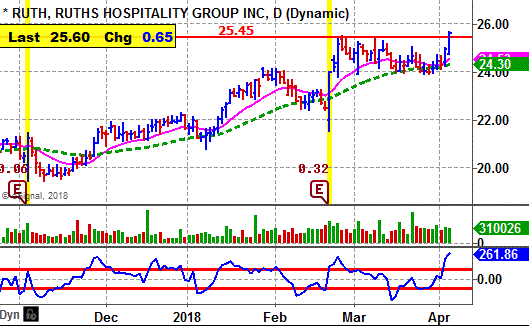
TTD's Quality Rating of Stock - RUTH - ABOVE AVERAGE |
|
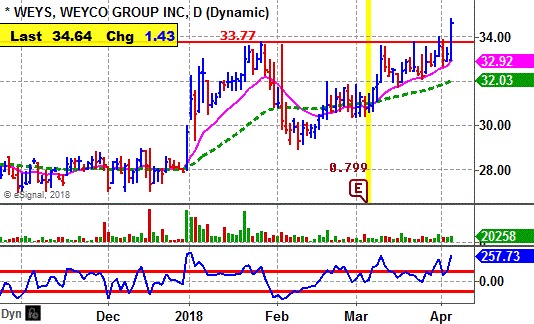
TTD's Quality Rating of Stock - WEYS - AVERAGE |

Ticker Tape Digest’s Daily List of “Stocks To Sell or Sell Short” ranks stocks well timed to be sold immediately based on daily trading. The list can be used as an alert to reduce current long-term positions.
Shorts from tape action so far today - 4
Stocks Screened - 12,234
Long-Term Environment for bears: Neutral.
Bear Side - Small list of breakdown stocks as stock market rallies to wipe out loss and then score a good gain.
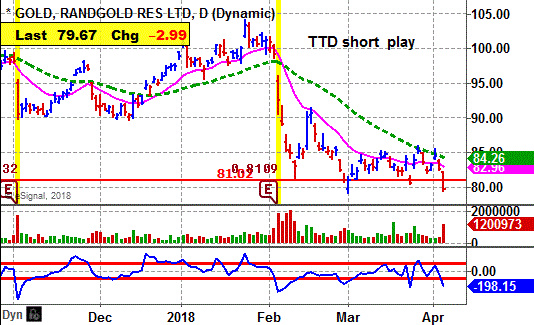
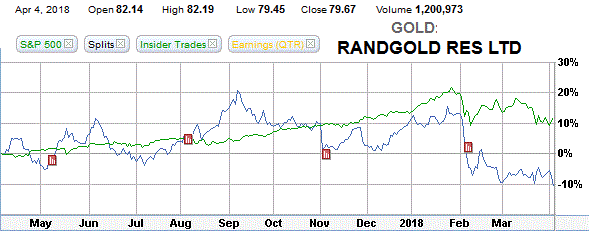
GOLD, based in England, is a gold mining firm operating in West and Central Africa. Annual revenues: $1.3 billion. GOLD's stock falls sharply Wednesday and undercuts key technical support. TTD sees more on the downside. 
So far today, GOLD is trading a heavy 1.2 million shares, more than double its average daily volume of 559,000 shares.
GOLD's stock fell in the morning and then touched an intraday low of $79.45 in the early afternoon.
The stock lifted slightly to around $80 and trended sideways. It slipped a little into the close. 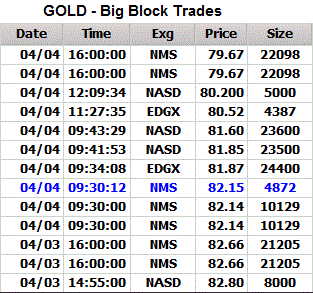
Tape Action
GOLD's tape action shows the recent block trades.
One can see the price for GOLD's blocks declining to $79.67 from $82.80.
A key bearish trade came late on Tuesday when a block of 21,205 shares (duplicated) crossed the tape at $82.66 from the prior block at $82.80 on 8,000 shares.
Then, near the close at block of 22,098 shares (duplicated) crossed the tape at $79.67 on 22,098 shares.
That was down from the prior block at $80.20 on 5,000 shares.
Business
GOLD operates mines, such as Morila, Loulo, Gounkoto, Tongon and Kibali. The Company is exploring in African countries such as Mali, Senegal, Cote d'Ivoire and the Democratic Republic of Congo.
The company also holds an interest in the Massawa project. The Company holds Morila Limited, which holds interests in the Morila mine in Mali.
Earnings:
This year, analysts are forecasting a 29% increase in net to $3.77 a share from the $2.92 the year before.
Net for the first quarter is expected to rise 23%, but then decline 5% in June.
Charts:
GOLD's daily chart shows the stock cutting below key technical support with an expansion in volume. The stock broke hard to the downside in early February when it reported earnings.
GOLD's 12-month performance chart shows the stock down 10% versus a 12% gain for the stock market.
Strategy Opinion: TTD is targeting GOLD for a decline to $70 within the next few months, or sooner. A protective stop buy can be placed near $82.50.
Suitability: Average Bears.
TTD's special probability research of Prior Performance:
Probability - Earnings Response - Bearish. GOLD rose just 4 times after the past 10 earnings reports when there was a significant change.
Probability: Seasonal Activity - Neutral. GOLD rose an average of 4.8% in April but fell 5.3% in May the past several years.
|
TTD's Quality Rating of Stock - GOLD - BELOW AVERAGE |
Stock Performance Chart with Quarterly Earnings Markers vs. S&P 500
Insider Buying in Green - Insider Selling in Red
TTD columnist Leo Fasciocco has covered the stock market for over 30 years. His articles appear in many publications. He has also been a speaker at the Money Show conferences. He has been on television and radio. He is author of many educational articles about stock investing and the book “Guide To High-Performance Investing.”

For information to subscribe to the Ticker Tape Digest Services call: Beverly Owen at 1-480-926-1680.
Distributed by Corona Publishing Enterprises. TickerTape Digest Inc. 1220 W. Sherri, Gilbert, Az. 85233.
TTD “Professional Report” is available on the Web: $100 per month. Password needed. Published daily - around 20 times a month.
TTD Pro Report includes a Morning chart slide show of breakout stocks, a Midsession video-audio show with commentary on breakout stocks and shorts and a Final end of day overall report on breakout stocks for the session, short plays and accumulation plays. There are other features too such as Quick Trades and Long-term Plays.
TTD Daily Report is $39. It covers a Morning slide show of charts of stocks breaking out and a TTD end of day print report covering breakout stocks and shorts.
Credit cards accepted. Payable to Corona Publishing Enterprises.
(The information contained has been prepared from data deemed reliable but there is no guarantee of complete accuracy. Ticker Tape Digest Inc. is not affiliated with any broker, dealer or investment advisor. Nothing in this publication constitutes an offer, recommendation or solicitation to buy or sell any securities. Further research is advised. This report is copyrighted and no redistribution is permitted with out permission.)