Daily - Go to TTD's Tape of Stock Charts - Friday, April 10, 2015
|
Daily - Go to TTD's Tape of Stock Charts - Friday, April 10, 2015 |
|
Weekly - Bullish Conservative Investors - Go To TTD Long-Term Plays - Monday, April 6, 2015 |
|
Go to Video Show - "How to Make Money With Breakout Stocks" |
|---|

By Leo Fasciocco -- TTD
Ticker Tape Digest presents its daily stock market report containing stocks to go long as breakout trades, quick trades, or bargain trades. We also feature stocks under Significant Accumulation that are poised to breakout.
|
Ticker Tape Digest's Daily schedule guide for TTD subscribers 1. Pre-market - check Breakout Watch List and Quick Trades. 2. Morning - (11:30 - 12 A.M.) - check breakout stocks tape and breakout chart slide show. 3. Midday (1 P.M.) check TTD Midsession Report and see market video show. 4. After close (4 P.M.) check final TTD Report for day. Trading Strategies Bullish Aggressive Investors Bullish - "Breakout Stocks" - ideally suited for bull markets and special situation stocks. Potential for large returns. (See Performance) Aggressive Investor Bullish- "Quick Trade Stocks" -ideally suited for entry into top performing issues looking for a small quick profit." (See Performance) Conservative Investors "Bargain Buy Trades for the Long Term." Ideally suited for entry into top performing big cap stocks on pullbacks within overall up trend.(See Performance) Bearish Aggressive Bearish Investors - "Breakdown Stocks" to Sell Short. Ideally suited for bear markets or market pull backs. Potential for large returns (See Performance) |
|---|
The TTD report also contains stocks to short as breakdown plays and as bargain (swing trade) shorts.
Investors should tend to try to go with a strategy that fits with the stock market's trend, unless there is a special situation play.
TTD's Breakout Stocks - Long are
most suitable for aggressive investors seeking ideal entry points into leading stocks, especially during bull markets. They can do extremely well in bull markets with gains of as much as several hundred percent. 
These stocks can also do extremely well during strong market rallies, or if they are in a industry group that is performing very well. They tend to have strong earnings outlooks and are near new-52 week, or all-time highs.
TTD Quick Trade Stocks - Long These are leading issues that have pulled back in recent days, but could move higher soon. They are most suitable for Aggressive Investors willing to trade short term. These stocks will do extremely well during market advances. They have about 74% win rate. During market rally sequences the win rate is even higher. The return is small 3% to 8% in just a few days.
TTD's Bargain Buy Trades - Long - Long Term. These are for conservative bullish Investors These long-term buys are ideally suited for entry into stocks on pull backs within overall up trend. These stocks can give a good return long-term especially during a bull market.
TTD also presents Stocks To Sell or Sell Short. These issues are suitable for aggressive investors willing to take short positions both as trades or for longer-term plays. These stocks will do very well during bear markets or market pull backs.
TTD's Bearish breakdown stocks to sell short. These issues have potential to fall sharply. They often show a technical breakdown and also some fundamental business problem such as weak earnings.
TTD's multi-media updates include a slide-show that presents charts and analysis at midsession. Some times TTD presents feature analysis on stocks and the market. TTD uses Windows Media Files. (WMV).
TTD also presents a "Breakout Watch List" that is up dated daily. This list consists of key stocks in position to breakout. A close watch of this list can put you in the stock just as it breaks out. A good idea is to study the list and be ready to move into a stock quickly as it hits its breakpoint.
TTD often suggests using stop buy orders to enter. It is very important to buy a breakout stock as close as possible to the breakpoint. The idea is to get "elbow room" if the stock should follow through to the upside. This is very important in being successful in making big money with breakout stocks.
It is also essential to have a stop loss strategy for all stocks in which positions are taken. Not every stock will work as expected. It is important for investors to "police" their portfolios and avoid getting trapped in any bad positions.
Quality rating of breakout Two key factors: 1 - Stock near all-time high in price or near a 52-week high. 2 - earnings growth current year is strong. The ideal play is a stock with an Above Average Quality Rating. The stock is near a new high and will have strong earnings. TTD's other ratings are Average and Below Average.
TTD also has special feature sections on Educational Tips on Investing.
To email Mr. Leo Fasciocco leo@tickertapedigest.com.For service, email Beverly Owen owen@tickertapedigest.com. TTD’s Tel: 1-480-926-1680.
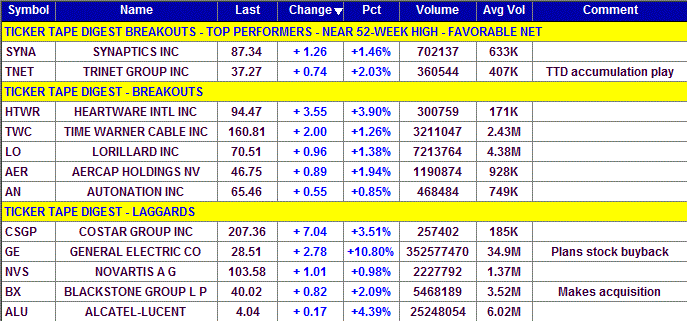
Breakout Stocks
Total Buy Breakouts so far today - 12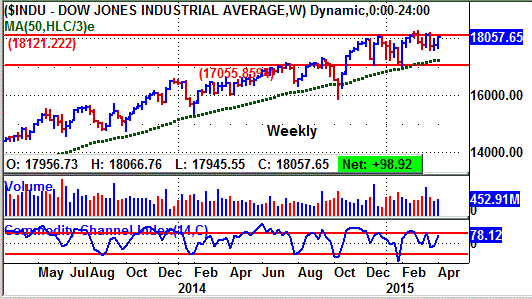
Overall Quality of Breakouts - AVERAGE
Stocks Screened - 8,300
Bull side - Breakout list large with some good looking plays. Bulls can be venturesome. Stock market holding in trading range. Earnings are coming.
(Put mouse on Dow chart to see Nasdaq chart)
Long Term Environment for bulls: Favorable
Stock Market Momentum
Market (Daily) - NYSE Bullish, Nasdaq Bullish
Market (Weekly) - NYSE Bearish, Nasdaq Bearish
Market (Monthly) - NYSE Bullish, Nasdaq Bullish
Ticker Tape Digest's
|
TTD's Quality Rating of Stock - SYNA - ABOVE AVERAGE |
SYNA, based in San Jose, Ca., makes touchpad input devices for mobile communications. Annual revenues: $1.3 billion. SYNA's stock breaks out today from a seven-week flat base. TTD featured SYNA on Thursday as a potential leader that could breakout. Friday, it did just that  and is near a new high.
So far today SYNA is trading 702,137 shares. Its average daily volume is 633,000 shares.
TTD featured SYNA as a breakout at our midsession video show on the Web Friday. 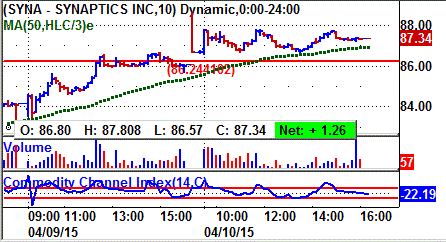
The stock advanced sharply in the morning to clear is breakpoint (see 10-minute chart)
The stock then trended sideways the rest of the day holding above its breakpoint line.
It then trended sideways through the afternoon touching a high for the day of 86.67. It then gave a little ground in the final hour.
SYNA's stock has been showing good accumulation on the tape.
One can see the price for the blocks climbing from %83.87 in the prior session to as high as $87.50.
One can see a bullish block coming late on Thursday when 12,695 shares (duplicated) crossed the tape at $86.08.
That was up from the prior block trade at $84.45 on 26,821 shares.
Then later in the morning a block of 11,720 shares crossed at 87.50. 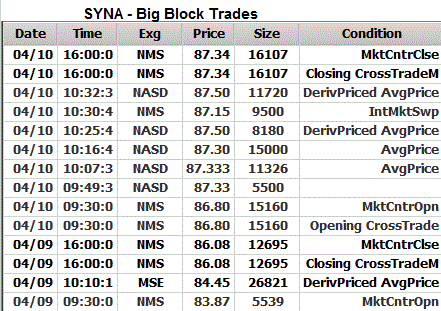
That was up from the prior block at $87.30 on 15,000 shares.
SYNA makes interface solutions for mobile computing and communications devices. It produces TouchPads for the notebook computer market.
Its other products include the TouchPad input device, TouchStyk pointing stick, Dual Pointing combination input solution, ClearPad touch screen, Spiral pen input solution, and QuickStroke Chinese handwriting software.
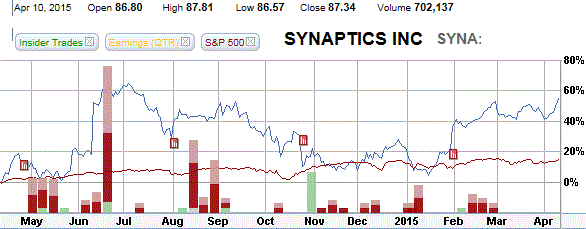
SYNA's 12-month performance chart shows the stock appreciating 58% versus an 18% gain for the S&P 500 index.
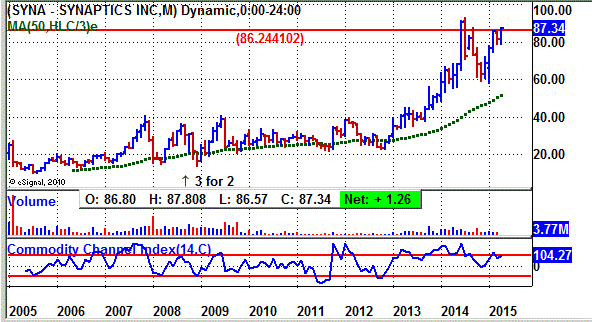
SYNA's long-term chart shows the stock climbing from $12 back in 2006 to a peak of $41 in 2007, the top in the prior bull market.
The stock then pulled back and trended in a trading range for several years - 2008 to 2012. It brokeout long-term in 2013 and surged to a peak of $93.26 in 2014.
The stock then pulled back and then rallied to form its current flat base. It is now in position to challenge its all-time high.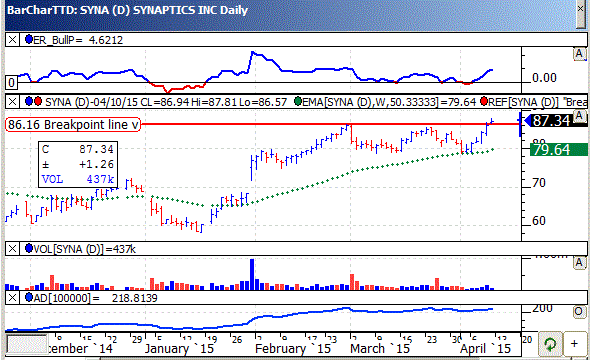
SYNA's daily chart shows the stock climbing from around 60 in January to a peak near 86.
It formed a flat base above its rising 50-day moving average line.
Today, it breaks out on modest volume.
The TTD momentum indicator (top of chart) is strongly bullish.
The accumulation - distribution line bottom of chart compliments the price action.
Analysts are forecasting a 32% jump in SYNA's earnings for the fiscal year ending in June to $4.86 a share from $3.67 a year ago.
The stock sells with a price-earnings ratio of 17. TTD sees that as low given the earnings growth rate. Thus, it is attractive for value-growth investors. 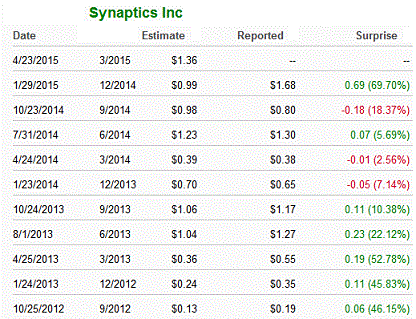
Looking ahead to fiscal 2016 ending in June, the Street expects a 26% gain in net to $6.13 a share from the anticipated $4.86 this year.
Profits for the upcoming fiscal third quarter ending in March should soar 258%. Analysts expect $1.36 a share, up from 38 cents a year ago.
The highest estimate on the Street is at $1.45 a share. TTD sees chances for an upside earnings surprise.
Looking ahead to the fiscal fourth quarter ending in June, net should rise 12% to $1.46 a share from $1.30 a year before.
Strategy Opinion: TTD is targeting SYNA for a move to 105. A protective stop can be placed near 81 giving it room.
TTD rates SYNA a good intermediate-term play.
Sponsorship: Average. The largest fund holder is 3-star rated Columbia Seligman Communications & Info Fund with a big 8.4% stake. It has held its position steady.
The largest fund buyer recently was Cambiar Small Cap Investment Fund which purchased 193,340 shares as a new position. The 3-star rated fund has a 0.53% stake.
SYNA has 36.7 million shares outstanding. Institutions hold 90% of the stock and insiders 9%.
Insider Activity: Bearish. Insiders were recent buyers using stock options at $26 to $35. They were sellers at $81.
Currently, 16 analysts follow the stock, 13 have a buy, down from 15 a year ago. SYNA has a book value of $19.49.
Stock Performance Chart with Quarterly Earnings Markers.
| TTD's Breakout Profile
Rating Synaptics Inc. - (SYNA) |
| TTD Check List | Bullish | Bearish | Neutral |
| Near 52-week High | YES | ||
| Volume | YES | ||
| Tick Volume | YES | ||
| Price Trend - Daily | YES | ||
| Price Trend - Long Term | YES | ||
| Price Daily Spread | YES | ||
| Base Structure | YES | ||
| Base - A-D | YES | ||
| Earnings-Quarterly | YES | ||
| Earnings-Long Term | YES | ||
| Earnings Outlook | YES | ||
| Industry Group | YES | ||
| Prior Breakout Success | YES | ||
| Fund Sponsorship | YES | ||
| Total Score | 12 | 0 | 2 |
Charts of Selected Breakout Stocks
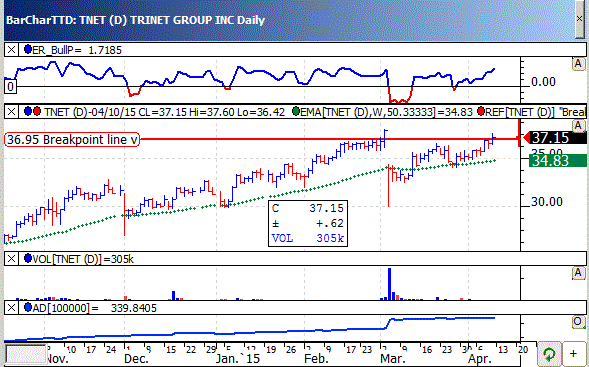
| TTD's Quality Rating of Stock - TNET - ABOVE AVERAGE |
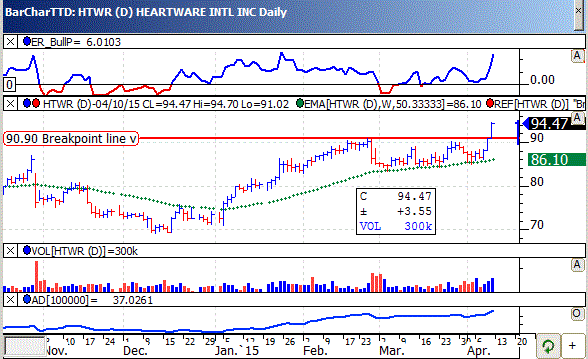
| TTD's Quality Rating of Stock - HTWR - AVERAGE |
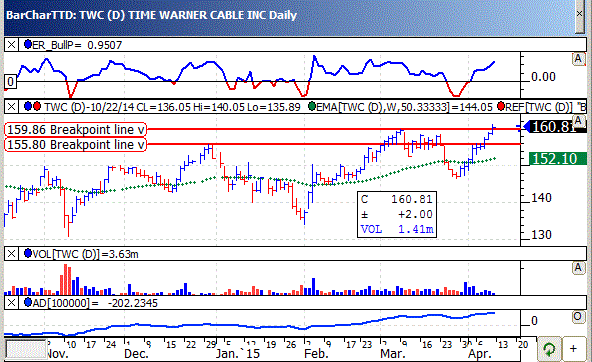
| TTD's Quality Rating of Stock - TWC - AVERAGE |
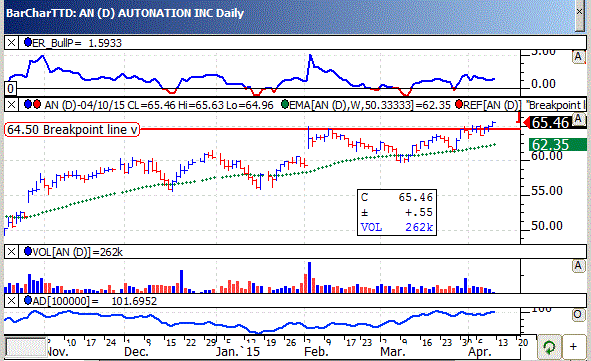
| TTD's Quality Rating of Stock - AN - AVERAGE |

Ticker Tape Digest’s Daily List of “Stocks To Sell or Sell Short” ranks stocks well timed to be sold immediately based on daily trading. The list can be used as an alert to reduce current long-term positions.
Shorts from tape action so far today - 4
Stocks Screened - 8,300
Long-Term Environment for bears: Unfavorable.
Bear Side - Small list of shorts today as stock market rallies strongly. Bears be conservative. Stock market rallies across trading range.
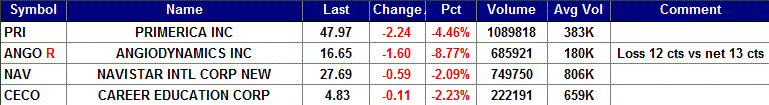
ANGO, based in Latham, N.Y., makes medical devices used radiologists and surgeons. Annual revenues: $358 million. ANGO's stock falls sharply Friday after the company reported disappointing results for the fiscal third quarter ended February 28. TTD sees more on the downside. 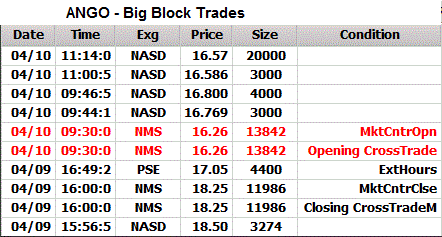
TTD highlighted ANGO as a short at our midsession video show on the Web Friday.
The company reported a loss of 12 cents a share for the quarter compared with net of 13 cents a share a year ago.
Analysts expected a profit of 16 cents a share for the quarter.
ANGO's stock spiked lower in the morning cutting below key support.
The stock hit a low of 16.53 in the morning. The stock then trended sideways the rest of the session fading a bit near the close.
ANGO's tape action shows the recent block trades.
One can see the price for the blocks falling from $18.50 in the prior session to as low as $16.26 on Friday.
A key bearish trade came late on Thursday when a block of 11,986 shares (duplicated) crossed the tape at $18.25.
That was down from the prior block at $18.50 on 3,274 shares.
ANGO makes medical devices used by interventional radiologists, vascular surgeons and other physicians for the minimally invasive diagnosis and treatment of peripheral vascular disease.
The company's product line includes angiographic products and accessories, dialysis products, vascular access products, PTA products, drainage products, thrombolytic products.
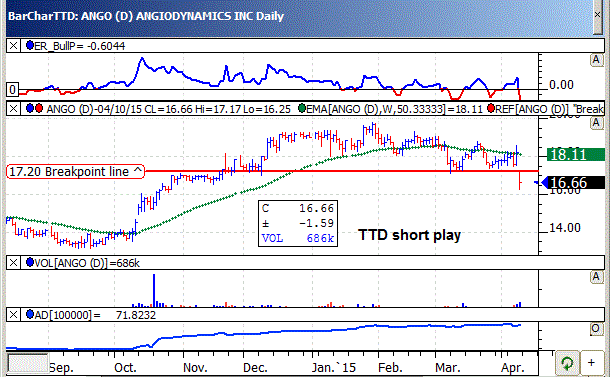
ANGO's daily chart shows the stock cutting below key support with volume. The stock's TTD momentum indicator (top of chart) is now bearish.
Analysts were looking for an 18% rise in earnings to 68 cents a share. However, that will be cut.
Strategy Opinion: TTD is targeting ANGO for a decline to 13 within the next few months or sooner. A protective stop buy can be placed near 17.80.
| TTD's Quality Rating of Stock - ANGO - BELOW AVERAGE |
TTD columnist Leo Fasciocco has covered the stock market for over 20 years. His articles appear in many publications. He is also a speaker at the Intershow conferences. He has been on television and radio. He is author of many educational articles about stock investing and the book “Guide To High-Performance Investing.”

For information to subscribe to the Ticker Tape Digest Services call: Beverly Owen at 1-480-926-1680. Distributed by Corona Publishing Enterprises. Ticker Tape Digest Inc. P.O. Box 2044 Chandler, Az. 85244-2044. TTD “Professional Report” is available on the World Wide Web: $100 per month. Password needed. “TTD Professional“ Faxed is $200 per month. The TTD
Daily Report is $39.95. Credit cards accepted.
(The information contained has been prepared from data deemed reliable but there is no guarantee of complete accuracy. Ticker Tape Digest Inc. is not affiliated with any broker, dealer or investment advisor. Nothing in this publication constitutes an offer, recommendation or solicitation to buy or sell any securities. Further research is advised. This report is copyrighted and no redistribution is permitted with out permission.)
