![]()
|
|
|
Weekly - Bullish Conservative Investors - Go To TTD Long-Term Plays - Monday, Aprl 15, 2019 |
|
|
Go to Video Show - "How to Make Money With Breakout Stocks |
|---|

By Leo Fasciocco -- TTD
Ticker Tape Digest presents its daily stock market report containing stocks to go long as Breakout Trades, Quick Trades, or Bargain Accumulation Trades.
We also feature stocks under Significant Accumulation that are poised to breakout.
|
Ticker Tape Digest's Daily schedule guide for TTD subscribers 1. Pre-market - check Breakout Watch List and Quick Trades. 2. Morning - (11:30 - 12 A.M.) - check breakout stocks tape and breakout chart slide show. 3. Midday (1 P.M.) check TTD Midsession Report and see market video show. 4. After close (4 P.M.) check final TTD Report for day. Trading Strategies Bullish Aggressive Investors Bullish - "Breakout Stocks" - ideally suited for bull markets and special situation stocks. Potential for large returns. (See Performance) Aggressive Investor Bullish- "Quick Trade Stocks" -ideally suited for entry into top performing issues looking for a small quick profit." (See Performance) Conservative Investors "Bargain Buy Trades for the Long Term." Ideally suited for entry into top performing big cap stocks on pullbacks within overall up trend.(See Performance) Bearish Aggressive Bearish Investors - "Breakdown Stocks" to Sell Short. Ideally suited for bear markets or market pull backs. Potential for large returns (See Performance) |
|---|
The TTD report also contains stocks to short as breakdown plays and as bargain (swing trade) shorts.
Investors should tend to try to go with a strategy that fits with the stock market's trend, unless there is a special situation play.
TTD's Breakout Stocks - Long are
most suitable for aggressive investors seeking ideal entry points into leading stocks, especially during bull markets. They can do extremely well in bull markets with gains of as much as several hundred percent. 
These stocks can also do extremely well during strong market rallies, or if they are in a industry group that is performing very well. They tend to have strong earnings outlooks and are near new-52 week, or all-time highs.
TTD Quick Trade Stocks - Long These are leading issues that have pulled back in recent days, but could move higher soon. They are most suitable for Aggressive Investors willing to trade short term. These stocks will do extremely well during market advances. They have about 74% win rate. During market rally sequences the win rate is even higher. The return is small 3% to 8% in just a few days.
TTD's Bargain Buy Trades - Long - Long Term. These are for conservative bullish Investors These long-term buys are ideally suited for entry into stocks on pull backs within overall up trend. These stocks can give a good return long-term especially during a bull market.
TTD also presents Stocks To Sell or Sell Short. These issues are suitable for aggressive investors willing to take short positions both as trades or for longer-term plays. These stocks will do very well during bear markets or market pull backs.
TTD's Bearish breakdown stocks to sell short. These issues have potential to fall sharply. They often show a technical breakdown and also some fundamental business problem such as weak earnings.
TTD's multi-media updates include a slide-show that presents charts and analysis at midsession. Some times TTD presents feature analysis on stocks and the market. TTD uses Windows Media Files. (WMV).
TTD also presents a "Breakout Watch List" that is up dated daily. This list consists of key stocks in position to breakout. A close watch of this list can put you in the stock just as it breaks out. A good idea is to study the list and be ready to move into a stock quickly as it hits its breakpoint.
TTD often suggests using stop buy orders to enter. It is very important to buy a breakout stock as close as possible to the breakpoint. The idea is to get "elbow room" if the stock should follow through to the upside. This is very important in being successful in making big money with breakout stocks.
It is also essential to have a stop loss strategy for all stocks in which positions are taken. Not every stock will work as expected. It is important for investors to "police" their portfolios and avoid getting trapped in any bad positions.
Quality rating of breakout Two key factors: 1 - Stock near all-time high in price or near a 52-week high. 2 - earnings growth current year is strong. The ideal play is a stock with an Above Average Quality Rating. The stock is near a new high and will have strong earnings. TTD's other ratings are Average and Below Average.
TTD also has special feature sections on Educational Tips on Investing.
To email Mr. Leo Fasciocco leo@tickertapedigest.com.
For service, email Beverly Owen owen@tickertapedigest.com. TTDÆs Tel: 1-480-926-1680.
Monday - April 15, 2019
TTD's Breakout Stocks
Stock Market Overview
Total Buy Breakouts so far today - 4
Quality of Breakouts - Average
Stocks Screened - 12,234
Bull side - Small list of breakouts. Bulls be conservative.
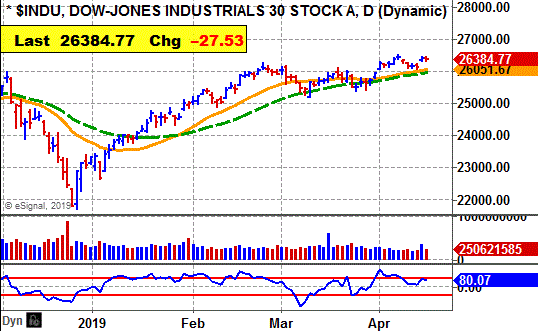
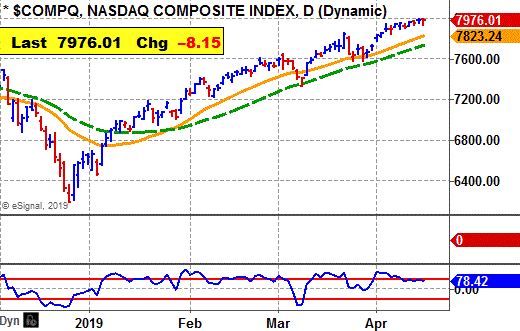
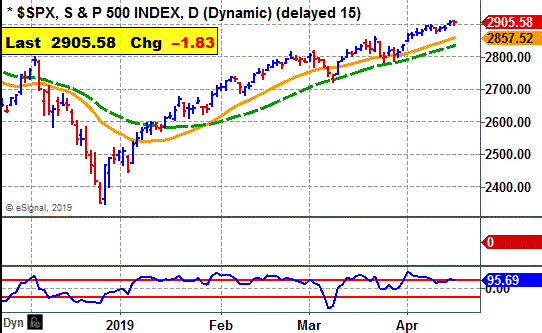
Stock market - Market averages are bullish in all time sectors.
Comment - TTD sees the market in a consolidation pattern near-term. Soon the earnings will be pouring in and there could be a big increase in market volatility.
See Latest Earnings Reports - A company that tops the Street's highest earnings estimate has potential to go higher. Earnings beats for Monday and stock rising - None
Stock Market Momentum
(Daily is based on a moving average)
|
Market (Daily) |
Market (Weekly) |
Market (Monthly) |
|
Dow - Bullish |
Dow - Bullish |
Dow - Bullish |
|
Nasdaq - Bullish |
Nasdaq - Bullish |
Nasdaq - Bullish |
|
S&P 500 - Bullish |
S&P 500 - Bullish |
S&P 500 - Bullish |
 Ticker Tape Digest's
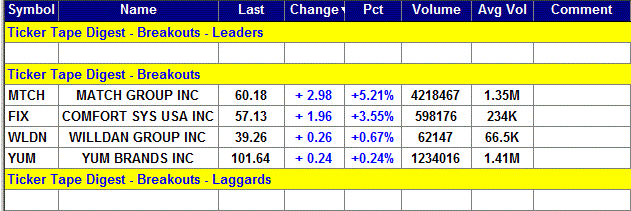
|
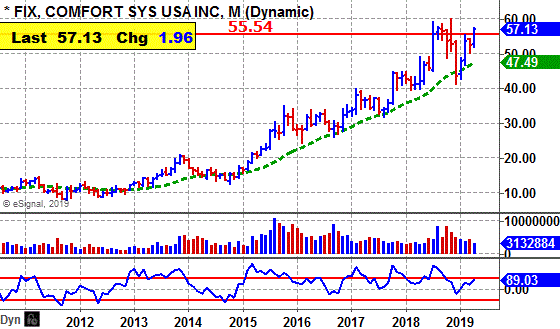
TTD's Quality Rating of Stock - FIX - ABOVE AVERAGE |
FIX, based in Houston, Tex., provides services covering heating and air conditioning. Annual revenues: $2.2 billion. FIX's stock moves higher Monday and breaks out from its nine-week, cup-and-handle base. 
So far today, FIX is trading 598,176 shares double its average daily volume of 234,000 shares.
TTD sees more on the upside.
TTD highlighted FIX as a breakout at our midsession video show on the Web Monday. 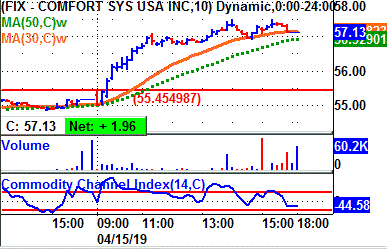
FIX's 10-minute chart shows the stock breaking out in the morning.
FIX reached a peak at 57.49 in the afternoon.
The stock then trended sideways into the close.
Tape Action
FIX's tape action shows the recent block trades.
One can see the price for the blocks climbing from $55.04 in the morning to as high as $57.43.
A key bullish trade came in the morning when a block of 2,000 shares crossed the tape at $55.46.
That was up from the prior block at $55.17 on 93,228 shares late in the prior session. 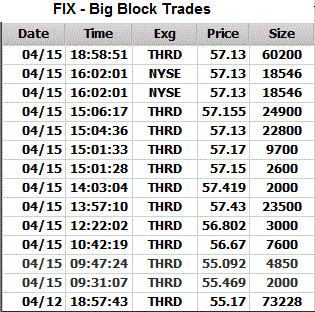
In after hours trading, a block of 60,200 shares crossed at $57.13.
That came on an up tick sequence started at $57.12 on 117 shares.
Business
FIX provides contracting services for heating, ventilation, air conditioning , plumbing, piping and also off-site construction.
The company has 38 operating units in 72 cities and 86 locations in the U.S.
FIX operates primarily in the commercial, industrial and institutional markets.
The company also provides remote monitoring of temperature, pressure, humidity and air flow for HVAC systems.
Charts
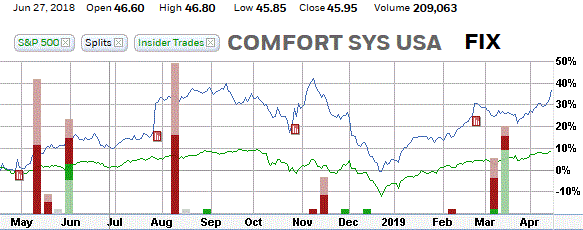
FIX's 12-month performance chart shows the stock appreciating 36% versus a 9% gain for the stock market.
Insiders were buyers using stock options at $11 to $13 a share. They were market buyers at %46 to $56 a share.
They were recent sellers at $47 to $55 a share.
FIX's long-term chart shows the stock bottoming at $12 back in 2014. Since then the stock has been trending steadily higher. It has made almost a fivefold move. 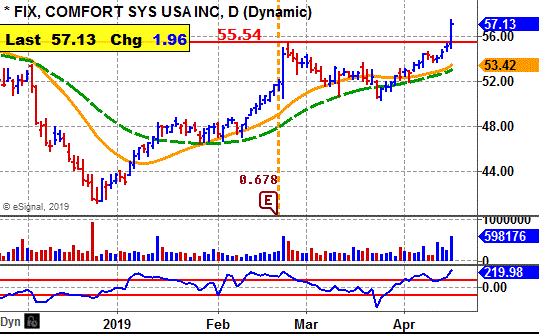
FIX's daily chart shows the stock climbing from $42 back in December to a peak near $55 by February.
FIX then put down a classic cup-and-handle base.
The breakout is solid coming with expanding volume and a widening of the daily spread.
The stock's CCI momentum indicator is strongly bullish.
Earnings Outlook
This year, analysts are forecasting a 12% increase in net to $3.35 a share from the $3 the year before.
The stock sells with a price-earnings ratio of 17.
Looking out to 2020, the Street predicts a 5% increase in net to $3.53 a share from the anticipated $3.35 this year.
For the upcoming first quarter, analysts expect a 25% jump in net to 55 cents a share from the 44 cents the year before.
The highest estimate on the Street is at 62 cents a share.
The company beat the Street estimate 5 out of the past 10 reports.
Net for the second quarter is expected to rise 11% to 88 cents a share from the 79 cents the year before.
Strategy Opinion: TTD is targeting FIX for a move to $68 within the next few months, or sooner.
A protective stop can be placed near $53.50.
Intermediate-Term Rating: Average.
Suitability: Average Bulls.
TTD's special research of Stock's Prior Performance:
Probability - Breakout Success - Bullish - FIX scored some good gains off some of its recent breakouts. The stock is in a long-term up trend.
Probability - Earnings Response - Very Bullish - FIX rose 8 times after the past 9 earnings reports when there was a significant change in price.
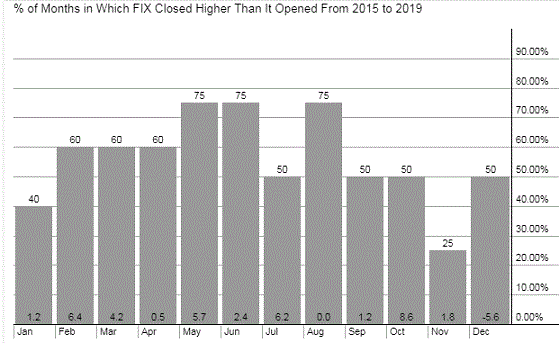
Probability: Seasonal Success - Bullish. - FIX averaged a gain of 0.5% in April and a gain of 5.7% in May the past several years.
Stock's Prior Performance After A Breakout
|
Stock's % Change from Breakout to peak - prior to cut below 50-day M/A. |
Date of Breakout |
Break point Price |
Stocks Price Peak after Breakout - prior to cut below 50-day M/A |
Date Trade Closed |
|
19% |
7/26/2018 |
48.95 |
58.35 |
9/12/2018 |
|
26% |
9/26/2017 |
34.94 |
44.30 |
10/31/2017 |
|
12% |
10/12/2015 |
29.90 |
33.61 |
12/7/2015 |
|
34% |
3/30/2015 |
21.18 |
28.45 |
8/7/2015 |
(In actual trading, entry and exit points could vary depending on broker execution.
Also, ideal are breakouts to a new 52-week high or better, perhaps all-time highs.)
Stock's Long-term Chart
Stock's Performance Chart with Quarterly Earnings Markers vs. S&P 500
Insider Buying in Green - Insider Selling in Red
Stock's Monthly Seasonal Performance Chart - Past 5 Years
Showing % Months UP and % Change
| TTD's Breakout Profile Rating Comfort Systems USA Inc. (FIX) |
| TTD Check List | Bullish | Bearish | Neutral |
| Near 52-week High | YES | ||
| Volume | YES | ||
| Tick Volume | YES | ||
| Price Trend - Daily | YES | ||
| Price Trend - Long Term | YES | ||
| Price Daily Spread | YES | ||
| Base Structure | YES | ||
| Base - A-D | YES | ||
| Earnings-Quarterly | YES | ||
| Earnings-Long Term | YES | ||
| Earnings Outlook | YES | ||
| Industry Group | YES | ||
| Prior Breakout Success | YES | ||
| Fund Sponsorship | YES | ||
| Total Score | 13 | 0 | 1 |
Charts of Selected Breakout Stocks
|
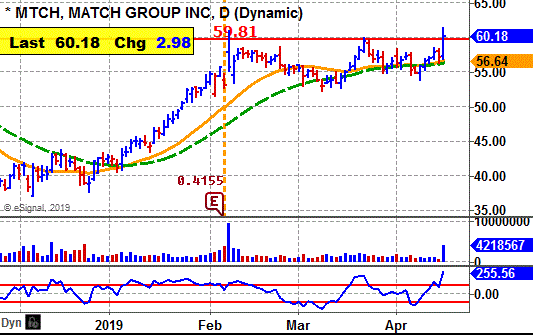
TTD's Quality Rating of Stock - MTCH - AVERAGE |
|
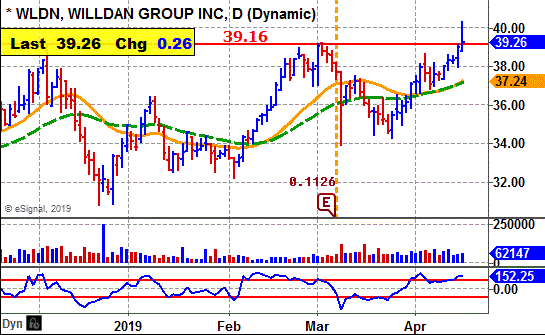
TTD's Quality Rating of Stock - WLDN - AVERAGE |
|
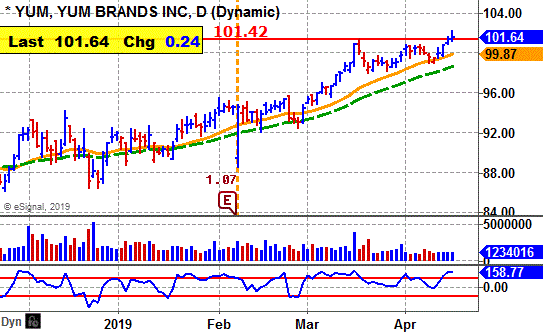
TTD's Quality Rating of Stock - YUM - AVERAGE |

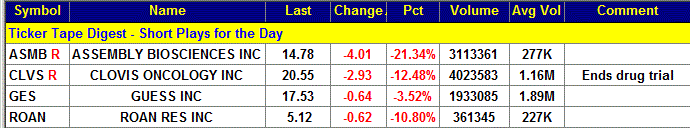
Ticker Tape DigestÆs Daily List of ōStocks To Sell or Sell Shortö ranks stocks well timed to be sold immediately based on daily trading. The list can be used as an alert to reduce current long-term positions.
Shorts from tape action so far today - 4
Stocks Screened - 12,234
Long-Term Environment for bears: Unfavorable.
Bear Side - Small list of breakdown stocks. Several biotech stocks on the list. Bears be conservative.
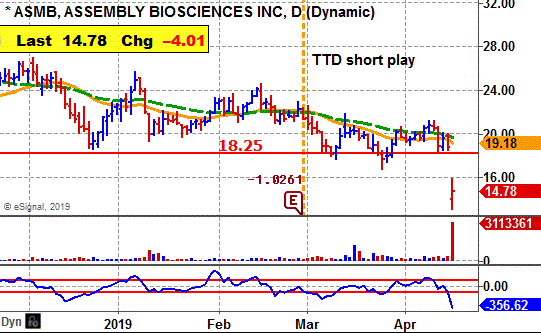
ASMB, based in Carmel, Ind., is a biotech firm working on treatments for hepatitis. Annual revenues: $14.8 million. ASMB's stock gaps sharply Monday and undercuts key technical support. 
So far today, ASMB is trading 3.1 million shares.11 times its average daily volume of 277,000 shares.
The stock's sharp decline was due to disappointing data on its antiviral drug candidate.
TTD sees more on the downside.
ASMB's stock gapped lower in the morning and touched an intraday low of 13.13. 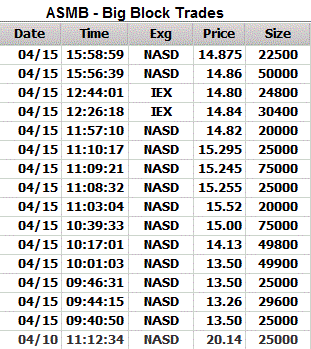
The stock lifted back to around $14.50 and then trended sideways the rest of the day.
Tape Action
ASMB's tape action shows the recent block trades.
One can see the price for the blocks falling from $20.14 last Wednesday to as low as $13.26.
A key bearish trade came in the morning when a block of 29,600 shares crossed the tape at 13.26.
That was down from the prior block at $13.50 on 25,000 shares.
Business
ASMB is developing two platform programs, such as a class of oral therapeutics to treat hepatitis B virus infection, and a class of oral synthetic live therapeutics to restore health to a dysbiotic microbiome.
It has discovered various core protein Allosteric Modulators, which are small molecules that directly target and allosterically modulate the HBV core.
Earnings:
This year, analysts are forecasting a loss of $4.61 a share compared with a loss of $3.98 the year before.
For the upcoming first quarter, analysts expect a loss of $1.07 a share compared with a loss of 80 cents the year before.
Looking out to 2020, the Street expects a loss of $5.18 a share compared with a loss of $4.61 the year before.
Charts:
ASMB's daily chart shows the stock gapping lower with massive volume. The stock has now fallen from $67 last year. It is in a long-term down trend.
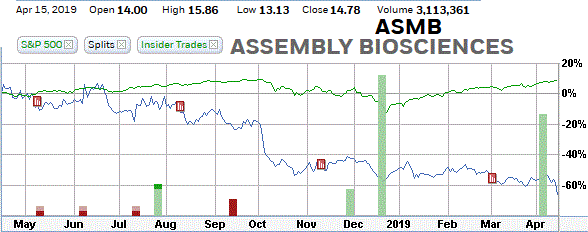
ASMB's 12-month performance chart shows the stock down 68% versus a 10% gain for the stock market.
Strategy Opinion: TTD is targeting ASMB for a decline to $11.50 within the next few months, or sooner. A protective stop buy can be placed near $15.50.
Suitability: Aggressive Bears.
TTD's probability research of Prior Performance:
Probability - Earnings Response - Bearish. - ASMB rose 2 times after the past 5 earnings reports when there was a significant change in price.
Probability: Seasonal Activity - Slightly Bullish - ASMB averaged a decline of 4.7% in April and a gain of 6.3% in May the past several years.
|
TTD's Quality Rating of Stock - ASMB - BELOW AVERAGE |
Stock's Performance Chart with Quarterly Earnings Markers vs. S&P 500
Insider Buying in Green - Insider Selling in Red
TTD columnist Leo Fasciocco has covered the stock market for over 30 years. His articles appear in many publications. He has also been a speaker at the Money Show conferences. He has been on television and radio. He is author of many educational articles about stock investing and the book ōGuide To High-Performance Investing.ö

For information to subscribe to the Ticker Tape Digest Services call: Beverly Owen at 1-480-878-8381 or 480-704-3331
Distributed by Corona Publishing Enterprises. TickerTape Digest Inc. 1220 W. Sherri, Gilbert, Az. 85233.
TTD ōProfessional Reportö is available on the Web: $100 per month. Password needed. Published daily - around 20 times a month.
TTD Pro Report includes a Morning chart slide show of breakout stocks, a Midsession video-audio show with commentary on breakout stocks and shorts and a Final end of day overall report on breakout stocks for the session, short plays and accumulation plays. There are other features too such as Quick Trades and Long-term Plays.
TTD Daily Report is $39. It covers a Morning slide show of charts of stocks breaking out and a TTD end of day print report covering breakout stocks and shorts.
Credit cards accepted. Payable to Corona Publishing Enterprises.
(The information contained has been prepared from data deemed reliable but there is no guarantee of complete accuracy. Ticker Tape Digest Inc. is not affiliated with any broker, dealer or investment advisor. Nothing in this publication constitutes an offer, recommendation or solicitation to buy or sell any securities. Further research is advised. This report is copyrighted and no redistribution is permitted with out permission.)