![]()
|
|
|
Go to Video Show - "How to Make Money With Breakout Stocks |
|---|

By Leo Fasciocco -- TTD
Ticker Tape Digest presents its daily stock market report containing stocks to go long as Breakout Trades, Quick Trades, or Bargain Accumulation Trades.
We also feature stocks under Significant Accumulation that are poised to breakout.
|
Ticker Tape Digest's Daily schedule guide for TTD subscribers 1. Pre-market - check Breakout Watch List and Quick Trades. 2. Morning - (11:30 - 12 A.M.) - check breakout stocks tape and breakout chart slide show. 3. Midday (1 P.M.) check TTD Midsession Report and see market video show. 4. After close (4 P.M.) check final TTD Report for day. Trading Strategies Bullish Aggressive Investors Bullish - "Breakout Stocks" - ideally suited for bull markets and special situation stocks. Potential for large returns. (See Performance) Aggressive Investor Bullish- "Quick Trade Stocks" -ideally suited for entry into top performing issues looking for a small quick profit." (See Performance) Conservative Investors "Bargain Buy Trades for the Long Term." Ideally suited for entry into top performing big cap stocks on pullbacks within overall up trend.(See Performance) Bearish Aggressive Bearish Investors - "Breakdown Stocks" to Sell Short. Ideally suited for bear markets or market pull backs. Potential for large returns (See Performance) |
|---|
The TTD report also contains stocks to short as breakdown plays and as bargain (swing trade) shorts.
Investors should tend to try to go with a strategy that fits with the stock market's trend, unless there is a special situation play.
TTD's Breakout Stocks - Long are
most suitable for aggressive investors seeking ideal entry points into leading stocks, especially during bull markets. They can do extremely well in bull markets with gains of as much as several hundred percent. 
These stocks can also do extremely well during strong market rallies, or if they are in a industry group that is performing very well. They tend to have strong earnings outlooks and are near new-52 week, or all-time highs.
TTD Swng - Quick Trade Stocks - Long These are leading issues that have pulled back in recent days, but could move higher soon. They are most suitable for Aggressive Investors willing to trade short term. These stocks will do extremely well during market advances. They have about 74% win rate. During market rally sequences the win rate is even higher. The return is small 3% to 8% in just a few days.
TTD also presents Stocks To Sell or Sell Short. These issues are suitable for aggressive investors willing to take short positions both as trades or for longer-term plays. These stocks will do very well during bear markets or market pull backs.
TTD's Bearish breakdown stocks to sell short. These issues have potential to fall sharply. They often show a technical breakdown and also some fundamental business problem such as weak earnings.
TTD's multi-media updates include a slide-show that presents charts and analysis at midsession. Some times TTD presents feature analysis on stocks and the market. TTD uses Windows Media Files. (WMV).
TTD also presents a "Breakout Watch List" that is up dated daily. This list consists of key stocks in position to breakout. A close watch of this list can put you in the stock just as it breaks out. A good idea is to study the list and be ready to move into a stock quickly as it hits its breakpoint.
TTD often suggests using stop buy orders to enter. It is very important to buy a breakout stock as close as possible to the breakpoint. The idea is to get "elbow room" if the stock should follow through to the upside. This is very important in being successful in making big money with breakout stocks.
It is also essential to have a stop loss strategy for all stocks in which positions are taken. Not every stock will work as expected. It is important for investors to "police" their portfolios and avoid getting trapped in any bad positions.
Quality rating of breakout Two key factors: 1 - Stock near all-time high in price or near a 52-week high. 2 - earnings growth current year is strong. The ideal play is a stock with an Above Average Quality Rating. The stock is near a new high and will have strong earnings. TTD's other ratings are Average and Below Average.
TTD also has special feature sections on Educational Tips on Investing.
To email Mr. Leo Fasciocco leo@tickertapedigest.com.
For service, email Beverly Owen owen@tickertapedigest.com. TTD’s Tel: 1-480-878-8381 or 480-704-3331.
Thursday - April 15, 2021
TTD's Breakout Stocks
Stock Market Overview
Total Buy Breakouts - 17
Quality of Breakouts - Above Average.
Stocks Screened - 12,234
Bull side - Large list of breakouts with some interesting plays.
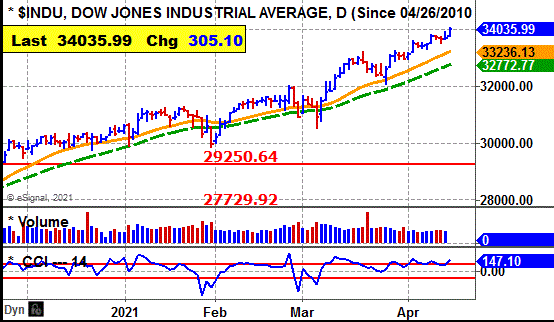
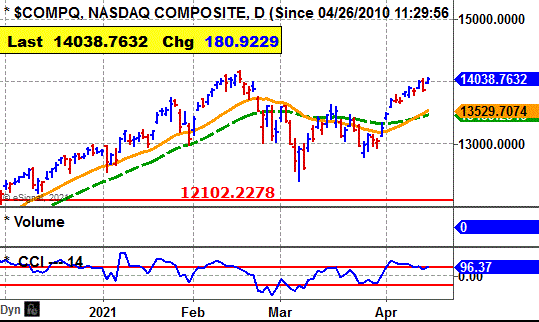
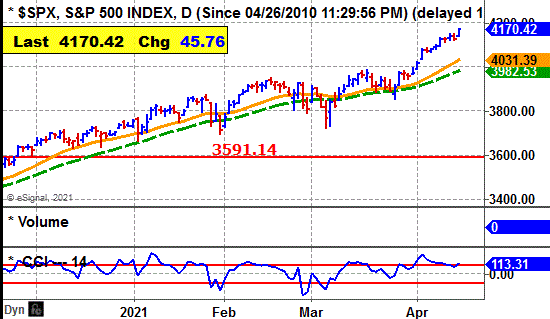
Stock market - Major averages are bullish in all time sectors.
Comment - Large list of breakouts with some interesting plays. Aggressive bulls can be venturesome.
See Latest Earnings Reports - A company that tops the Street's highest earnings estimate has potential to go higher. Key earnings beats - UNH, BLK, PPG, LAKE, MRTN and JBHT.
Stock Market Momentum
(Daily is based on a moving average)
|
Market (Daily) |
Market (Weekly) |
Market (Monthly) |
|
Dow - Bullish |
Dow - Bullish |
Dow - Bullish |
|
Nasdaq - Bullish |
Nasdaq - Bullish |
Nasdaq - Bullish |
|
S&P 500 - Bullish |
S&P 500 - Bullish |
S&P 500 - Bullish |
 Ticker Tape Digest's
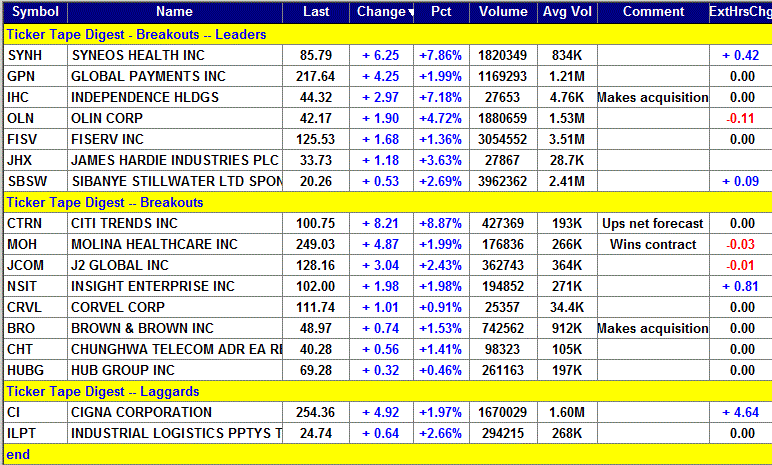
|
TTD's Quality Rating of Stock - GPN - ABOVE AVERAGE |
GPN, based in Atlanta, provides payment technology services. Annual revenues: $7.4 billion. GPN's stock moved higher in the morning and cleared its breakpoint line. 
The move clears a 16-week, cup-and-handle base, and hits a new high.
So far today, GPN is trading 1.2 million shares, the same as its average daily volume.
TTD sees potential for more on the upside.
TTD highlighted GPN as a breakout at our midsession video show.
GPN reached an intraday high of $219.14 in the morning.
The stock then pulled back slightly and trended sideways the rest of the day. 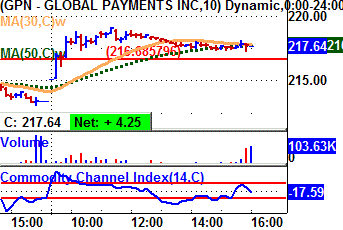
GPN was unchanged in after hours trading.
Tape Action
GPN's tape action shows the recent block trades.
One can see the price for the blocks rising from $213.39 in the prior session to as high as $218.91 in the morning.
A key bullish trade came in the morning when a block of 8,144 shares (duplicated) crossed the tape at $215.21.
That was up from the massive block late on Wednesday when 153,566 shares crossed at $213.39.
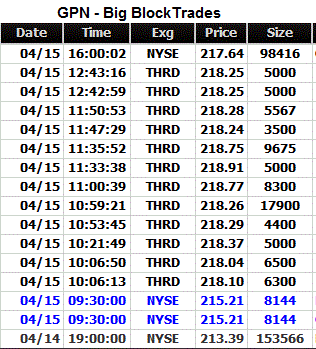 Near the close Thursday a block of 98,416 shares crossed at $217.64.
That came on a down tick from a prior trade in the sequence at $217.74 on 900 shares.
So, there was some profit taking near the close.
Business
GPN provides payment technology services.
The company operates through three segments: Merchant solutions, issuer solutions and business and consumer solutions.
GPN primarily provides payment solutions for credit cards, debit cards, electronic payments and check-related services.
The firm provides services for merchants and partners in over 100 countries throughout North America, Europe, Asia-Pacific and Latin America.
Charts
GPN's 12-month performance chart shows the stock up 55% versus a 50% gain for the stock market.
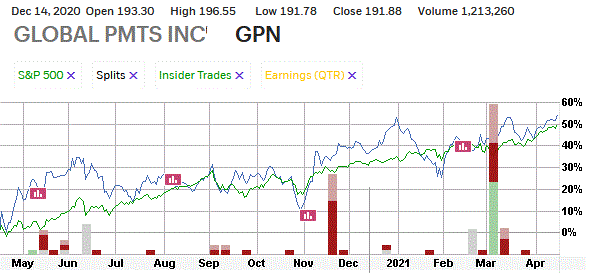
Insides were recent buyers at $54.91 to $199 a share using stock options.
They were sellers at $190 to $214 a share.
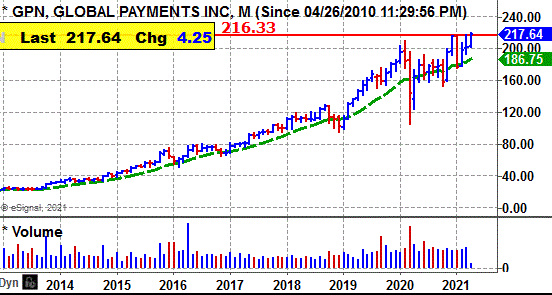
GPN's long-term chart shows the stock climbing from $23 back in 2014 to $209 by 2020 - a fantastic move.
However, the stock was pulled down to $105 by the 2020 sell off. Since then, GPN as rallied strongly and now reaches a new all-time high. 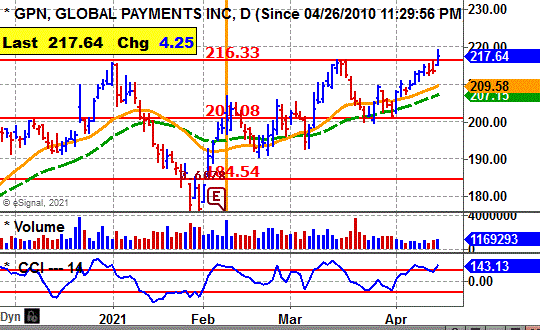
GPN's daily chart shows the stock climbing from $180 back in February to $216 by March.
The stock put down a well formed cup-and-handle base.
The breakout clears the base with a modest pick up in volume.
The stock's CCI momentum indicator is strongly bullish.
Earnings Outlook
This year, the Street is forecasting a 24% jump in net to $7.95 a share from the $6.40 the prior year.
The stock has a price-earnings ratio of 27. TTD sees that as reasonable.
Looking out to 2022, analysts predict a 17% rise in net to $9.32 a share from the anticipated $7.95 this year.
Profits for the first quarter should rise 13% to $1.78 a share from $1.58 the prior year.
The highest estimate on the Street is at $1.85 a share.
The company beat the Street estimate the past four quarters by 3 cents a share, 6 cents, 17 cents and 6 cents.
Net for the second quarter should surge 43% to $1.87 a share from the $1.31 the previous year.
Strategy Opinion: TTD is targeting GPN for a move to $255 within the next few months, or sooner.
A protective stop can be placed near $210.
Intermediate-Term Rating: Average.
Suitability: Average Bulls.
TTD's special research of Stock's Prior Performance:
|
Breakout Success |
Bullish |
GPN scored good gains off recent breakouts. |
|
Response to Net |
Bullish |
GPN rose 11 times after 14 earnings reports. |
|
Seasonal Success |
Bullish |
GPN avg. gain 5.5% in April , 6% in May prior years. |
|
Earnings Beats |
Bullish |
GPN beat Street net estimate 19 times after 20 reports. |
Stock's Prior Performance After A Breakout
|
Stock's % Change from Breakout to peak - prior to cut below 50-day M/A. |
Date of Breakout |
Break point Price |
Stocks Price Peak after Breakout - prior to cut below 50-day M/A |
Date Trade Closed |
|
16% |
11/16/202 | 185.15 | 215.42 | 12/31/2020 |
|
18% |
12/13/2019 | 176.02 | 208.47 | 2/20/2020 |
|
31% |
3/8/2019 | 129.31 | 169.64 | 7/26/2019 |
|
11% |
5/5/2017 | 82.41 | 91.72 | 6/5/2017 |
(In actual trading, entry and exit points could vary depending on broker execution.
Also, ideal are breakouts to a new 52-week high or better, perhaps all-time highs.)
Stock's Long-term Chart
Stock's Price Performance after Reporting Earnings
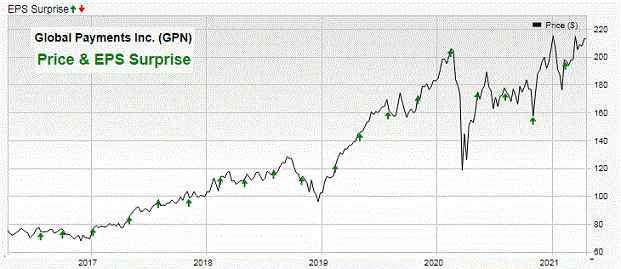
Stock's Performance Chart with Quarterly Earnings Markers vs. S&P 500
Insider Buying in Green - Insider Selling in Red
Charts of Selected Breakout Stocks
|
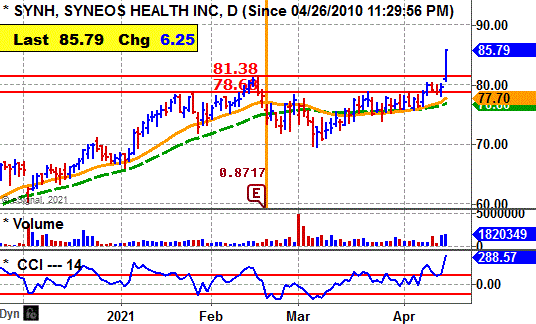
TTD's Quality Rating of Stock - SYNH - ABOVE AVERAGE |
|
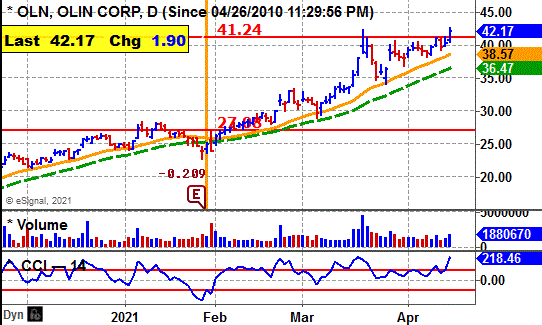
TTD's Quality Rating of Stock - OLN - ABOVE AVERAGE |
|
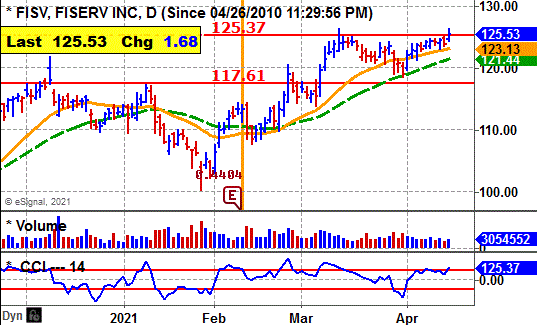
TTD's Quality Rating of Stock - FISV - ABOVE AVERAGE |
|
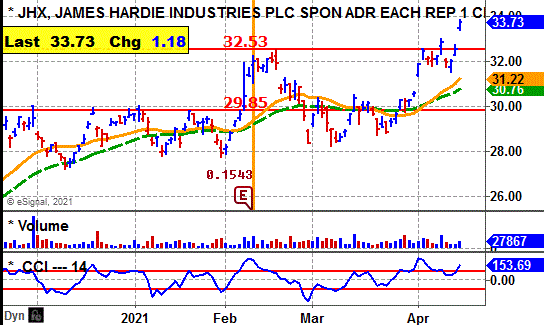
TTD's Quality Rating of Stock - JHX - ABOVE AVERAGE |

Ticker Tape Digest’s Daily List of “Stocks To Sell or Sell Short” ranks stocks well timed to be sold immediately based on daily trading. The list can be used as an alert to reduce current long-term positions.
Shorts from tape action - 2
Stocks Screened - 12,234
Long-Term Environment for bears: Unfavorable.
Bear Side - Just two short plays. Bears remain conservative.

YSG, based in China, produces and sells cosmetics and skincare products. Annual revenues: 5.2 million Chinese Yuan. USG's stock falls sharply Thursday and undercuts key technical support. 
So far today, YSG is trading 2.3 million shares. Its average daily volume is 2.6 million shares.
TTD sees potential for more on the downside, especially since the stock is now in a long-term down trend from a peak at $25 earlier this year. . 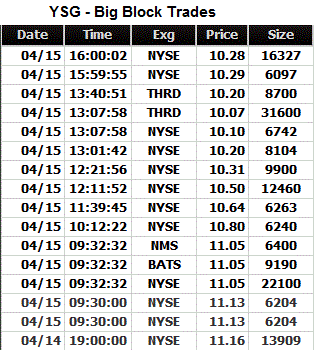
YSG's stock moved lower in the morning and undercut key technical support around noon.
The stock touched an intraday low of $10.05 in the early afternoon.
It then lifted slightly and trended sideways the rest of the day.
Tape Action
YSG's tape action shows the recent block trades.
One can see the price for the blocks falling from $11.16 in the prior session to as low as $10.07 in the afternoon.
A key bearish trade came in the morning when a block of 6,204 shares (duplicated) crossed the tape at $11.13.
That was down from the prior block the day before at $11.16 on 13,909 shares.
Business
YSG's cosmetic brands are Perfect Diary, Little Ondine and Abby’s Choice.
It sells through multiple online channels to end consumers and third-party platform distributors.
Earnings:
This year, analysts predict a loss of 18 cents a share. versus a loss of $1.58 the prior year.
Looking to 2022, the Street expects a loss of one cent a share.
For the first quarter, YSG is expected to show a loss of 2 cents a share.
Charts:
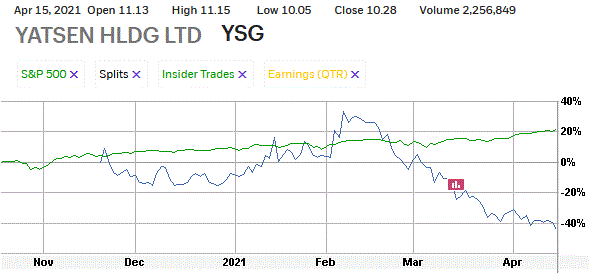
YSG's daily chart shows the stock falling from $25 down to $10.90. The stock tried to form a bottom, but is now breaking down again.
The past six months the stock has tumbled 40% versus a 20% gain for the stock market.
Strategy Opinion: TTD is targeting YSG for a decline to $8 within the next few months, or sooner. A protective stop buy can be placed near $11.
Suitability: Aggressive Bears.
TTD's Stock Probability research of Prior Performance:
|
Response to Net |
Bearish |
YSG fell 1 time after 1 earnings report. |
|
Seasonal Success |
Bearish |
YSG loss avg 16.8% in April. |
|
Earnings Beats |
Bearish |
YSG missed Street estimate 1 time after 1 report. |
|
TTD's Quality Rating of Stock - YSG - BELOW AVERAGE |

Stock's Performance Chart with Quarterly Earnings Markers vs. S&P 500
Insider Buying in Green - Insider Selling in Red
TTD columnist Leo Fasciocco has covered the stock market for over 30 years. His articles appear in many publications. He has also been a speaker at the Money Show conferences. He has been on television and radio. He is author of many educational articles about stock investing and the book “Guide To High-Performance Investing.”

For information to subscribe to the Ticker Tape Digest Services call: Beverly Owen at 1-480-704-3331.
Distributed by Corona Publishing Enterprises. TickerTape Digest Inc. 1220 W. Sherri, Gilbert, Az. 85233.
TTD “Professional Report” is available on the Web: $100 per month. Password needed. Published daily - around 20 times a month.
TTD Pro Report includes a Morning chart slide show of breakout stocks, a Midsession video-audio show with commentary on breakout stocks and shorts and a Final end of day overall report on breakout stocks for the session, short plays and accumulation plays. There are other features too such as Quick Trades and Long-term Plays.
TTD Daily Report is $39. It covers a Morning slide show of charts of stocks breaking out and a TTD end of day print report covering breakout stocks and shorts.
Credit cards accepted. Payable to Corona Publishing Enterprises.
(The information contained has been prepared from data deemed reliable but there is no guarantee of complete accuracy. Ticker Tape Digest Inc. is not affiliated with any broker, dealer or investment advisor. Nothing in this publication constitutes an offer, recommendation or solicitation to buy or sell any securities. Further research is advised. This report is copyrighted and no redistribution is permitted with out permission.)