![]()
|
|
|
Weekly - Bullish Conservative Investors - Go To TTD Long-Term Plays - Monday, Aprl 15, 2019 |
|
|
Go to Video Show - "How to Make Money With Breakout Stocks |
|---|

By Leo Fasciocco -- TTD
Ticker Tape Digest presents its daily stock market report containing stocks to go long as Breakout Trades, Quick Trades, or Bargain Accumulation Trades.
We also feature stocks under Significant Accumulation that are poised to breakout.
|
Ticker Tape Digest's Daily schedule guide for TTD subscribers 1. Pre-market - check Breakout Watch List and Quick Trades. 2. Morning - (11:30 - 12 A.M.) - check breakout stocks tape and breakout chart slide show. 3. Midday (1 P.M.) check TTD Midsession Report and see market video show. 4. After close (4 P.M.) check final TTD Report for day. Trading Strategies Bullish Aggressive Investors Bullish - "Breakout Stocks" - ideally suited for bull markets and special situation stocks. Potential for large returns. (See Performance) Aggressive Investor Bullish- "Quick Trade Stocks" -ideally suited for entry into top performing issues looking for a small quick profit." (See Performance) Conservative Investors "Bargain Buy Trades for the Long Term." Ideally suited for entry into top performing big cap stocks on pullbacks within overall up trend.(See Performance) Bearish Aggressive Bearish Investors - "Breakdown Stocks" to Sell Short. Ideally suited for bear markets or market pull backs. Potential for large returns (See Performance) |
|---|
The TTD report also contains stocks to short as breakdown plays and as bargain (swing trade) shorts.
Investors should tend to try to go with a strategy that fits with the stock market's trend, unless there is a special situation play.
TTD's Breakout Stocks - Long are
most suitable for aggressive investors seeking ideal entry points into leading stocks, especially during bull markets. They can do extremely well in bull markets with gains of as much as several hundred percent. 
These stocks can also do extremely well during strong market rallies, or if they are in a industry group that is performing very well. They tend to have strong earnings outlooks and are near new-52 week, or all-time highs.
TTD Quick Trade Stocks - Long These are leading issues that have pulled back in recent days, but could move higher soon. They are most suitable for Aggressive Investors willing to trade short term. These stocks will do extremely well during market advances. They have about 74% win rate. During market rally sequences the win rate is even higher. The return is small 3% to 8% in just a few days.
TTD's Bargain Buy Trades - Long - Long Term. These are for conservative bullish Investors These long-term buys are ideally suited for entry into stocks on pull backs within overall up trend. These stocks can give a good return long-term especially during a bull market.
TTD also presents Stocks To Sell or Sell Short. These issues are suitable for aggressive investors willing to take short positions both as trades or for longer-term plays. These stocks will do very well during bear markets or market pull backs.
TTD's Bearish breakdown stocks to sell short. These issues have potential to fall sharply. They often show a technical breakdown and also some fundamental business problem such as weak earnings.
TTD's multi-media updates include a slide-show that presents charts and analysis at midsession. Some times TTD presents feature analysis on stocks and the market. TTD uses Windows Media Files. (WMV).
TTD also presents a "Breakout Watch List" that is up dated daily. This list consists of key stocks in position to breakout. A close watch of this list can put you in the stock just as it breaks out. A good idea is to study the list and be ready to move into a stock quickly as it hits its breakpoint.
TTD often suggests using stop buy orders to enter. It is very important to buy a breakout stock as close as possible to the breakpoint. The idea is to get "elbow room" if the stock should follow through to the upside. This is very important in being successful in making big money with breakout stocks.
It is also essential to have a stop loss strategy for all stocks in which positions are taken. Not every stock will work as expected. It is important for investors to "police" their portfolios and avoid getting trapped in any bad positions.
Quality rating of breakout Two key factors: 1 - Stock near all-time high in price or near a 52-week high. 2 - earnings growth current year is strong. The ideal play is a stock with an Above Average Quality Rating. The stock is near a new high and will have strong earnings. TTD's other ratings are Average and Below Average.
TTD also has special feature sections on Educational Tips on Investing.
To email Mr. Leo Fasciocco leo@tickertapedigest.com.
For service, email Beverly Owen owen@tickertapedigest.com. TTD’s Tel: 1-480-926-1680.
Tuesday - April 16, 2019
TTD's Breakout Stocks
Stock Market Overview
Total Buy Breakouts so far today - 8
Quality of Breakouts - Average
Stocks Screened - 12,234
Bull side - Large list of breakouts, but very selective.
Stock market - Market averages remain bullish in all time sectors.
Comment - TTD sees the stock market holding in its overall up trend. Earnings will come soon and have an impact on the market.
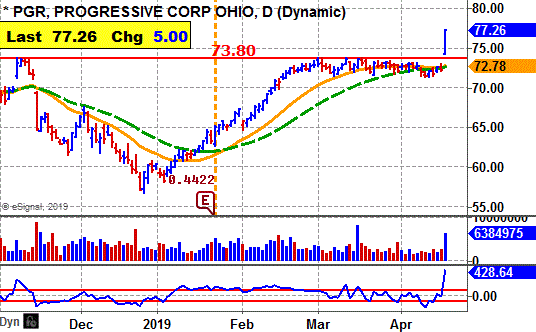
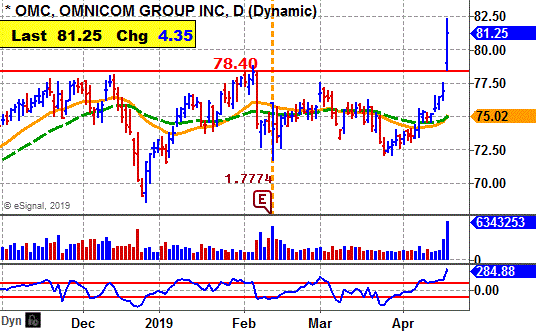
See Latest Earnings Reports - A company that tops the Street's highest earnings estimate has potential to go higher. Earnings beats for Tuesday - IBKR, NFLX, PGR, UAL, CSX, MLNX, OMC, BAC, CMA and BLK.
Stock Market Momentum
(Daily is based on a moving average)
|
Market (Daily) |
Market (Weekly) |
Market (Monthly) |
|
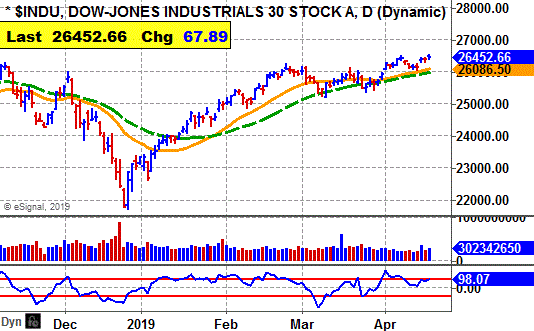
Dow - Bullish |
Dow - Bullish |
Dow - Bullish |
|
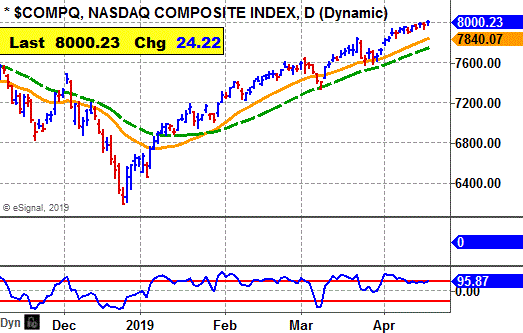
Nasdaq - Bullish |
Nasdaq - Bullish |
Nasdaq - Bullish |
|
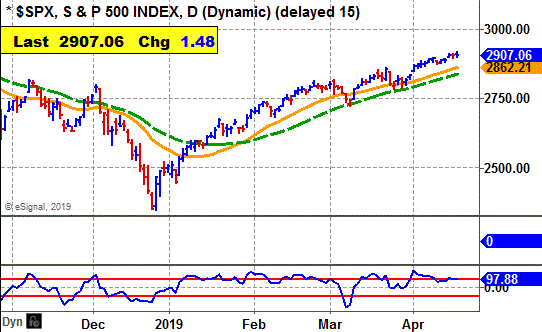
S&P 500 - Bullish |
S&P 500 - Bullish |
S&P 500 - Bullish |
 Ticker Tape Digest's
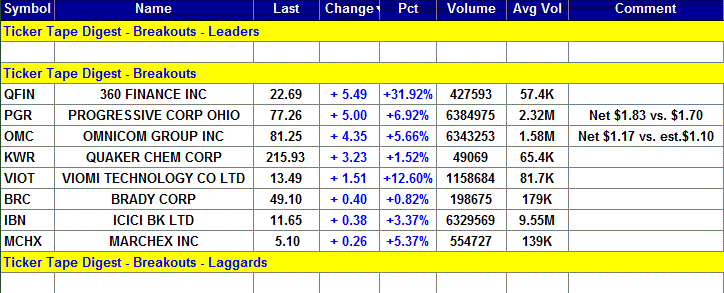
|
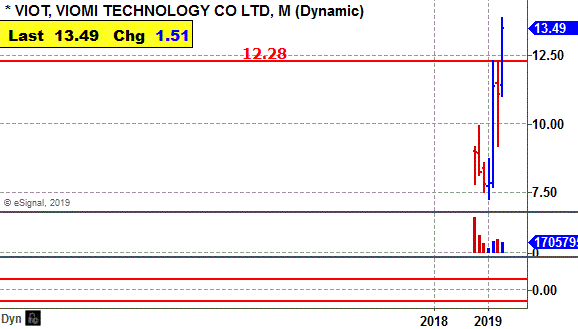
TTD's Quality Rating of Stock - VIOT - AVERAGE |
VIOT Technology Co. Ltd., based in China, sells home products on the internet. Annual revenues: 2.6 billion yuan. VIOT's stock moves sharply higher Friday and breaks out from its seven-week, cup-and-handle base.
The Chinese stock is a recent new issue coming out in September of last year. The move carries the stock to a new all-time high.
So far today, VIOT is trading a heavy 1.2 million shares, 12 times its average daily volume of 81,722 shares.
The stock moved sideways in the morning. Then around noon it spiked higher and by early afternoon had cleared its breakpoint. 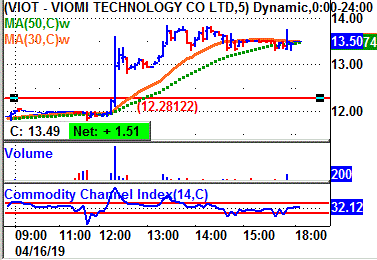
The stock closed near its high for the day. That is bullish.
Tape Action
VIOT's tape action shows the recent block trades.
One can see the price for the blocks climbing from $11.89 in a prior session to as high as by the afternoon 13.75.
A key bullish trade came in the morning when a block of 3,000 shares crossed the tape at $11.99.
That was up from the prior block trade late on Monday at $11.89 on 10,972 shares
Near the close a block of 423,402 shares crossed the tape at $13.49. 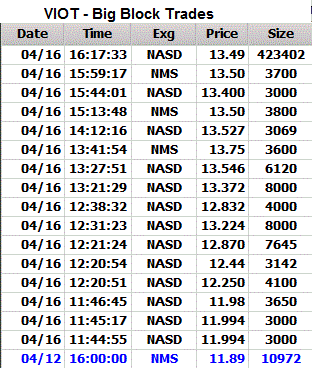
That actually came on an up tick from the prior trade in the sequence at $13.31 on 200 shares.
Business
VIOT operates on the Internet the Things (IoT) Home platform, through which sells products for the home.
The company sells mainly smart home products. Its flagship line includes smart water purification systems and smart kitchen products.
In addition, the company sells water purifier filters, water quality meters and water filter pitchers.
Charts
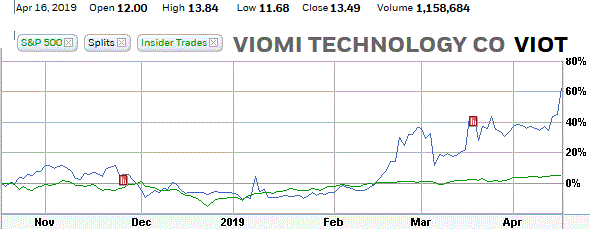
VIOT's 6-month performance chart shows the stock up 62% versus a 9% decline for the stock market.
Insider activity is not available.
VIOT's long-term chart covers just about six months. It shows the stock reaching a peak back in September when it opened. It touched $10.95.
The stock then trended mostly sideways, although it did dip to an intraday low of $7.24 in early January. Since then, VIOT moved higher and now reaches an all-time high. 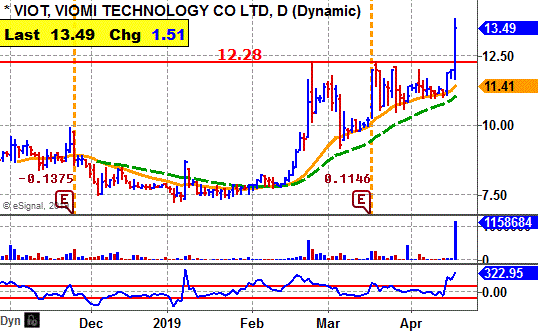
VIOT's daily chart shows the stock driving out of a flat base with a big expansion in volume and a widening of the daily spread.
That is a powerful breakout.
The new high is also a bullish omen.
VIOT's CCI momentum indicator is strongly bullish.
Earnings Outlook
This year, analysts are forecasting a 5% rise in profits to 97 cents a share from 92 cents for 2018.
There is only one analysts tracking the stock.
Going out to 2002, the Street predicts a 79% jump in net to $1.74 a share from the anticipated 97 cents this year.
Profits for the first quarter are expected to come in at 17 cents a share. There was no report available for the prior year.
Then in the second quarter analysts predict a profit of 24 cents a share.
Strategy Opinion: TTD is targeting VIOT for a move to $17.50 within the next few months, or sooner. A protective stop can be placed near $11.90.
Intermediate-Term Rating: Average.
Suitability: Aggressive Bulls.
TTD's special research of Stock's Prior Performance:
Probability - Breakout Success - Bullish.. - VIOT scored one small gain but is now working on a bigger one off its second breakout.
Probability - Earnings Response - Neural - VIOT rose one time after two earnings report when there was a significant change in price.
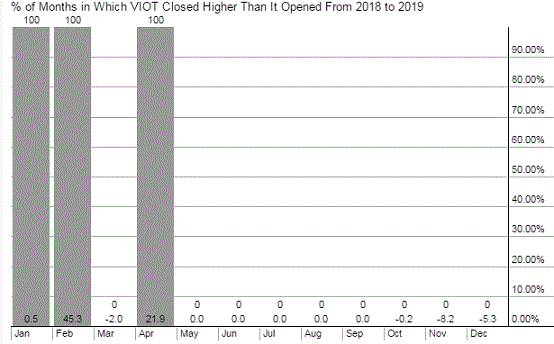
Probability: Seasonal Success - Very Bullish - VIOT averaged a gain of 2% in March, but rose an average of 22% in April
Stock's Prior Performance After A Breakout
|
hange from Breakout to peak - prior to cut below 50-day M/A. |
Date of Breakout |
Break point Price |
Stocks Price Peak after Breakout - prior to cut below 50-day M/A |
Date Trade Closed |
|
11% |
4/16/2019 |
12.13 |
13.49 |
Still in play |
|
2% |
11/1/2018 |
9.16 |
9.33 |
11/23/18 |
(In actual trading, entry and exit points could vary depending on broker execution.
Also, ideal are breakouts to a new 52-week high or better, perhaps all-time highs.)
Stock's Long-term Chart
Stock's Performance Chart with Quarterly Earnings Markers vs. S&P 500
Insider Buying in Green - Insider Selling in Red
Stock's Monthly Seasonal Performance Chart - Past 5 Years
Showing % Months UP and % Change
| TTD's Breakout Profile Rating Viomi Technology Co. (VIOT) |
| TTD Check List | Bullish | Bearish | Neutral |
| Near 52-week High | YES | ||
| Volume | YES | ||
| Tick Volume | YES | ||
| Price Trend - Daily | YES | ||
| Price Trend - Long Term | YES | ||
| Price Daily Spread | YES | ||
| Base Structure | YES | ||
| Base - A-D | YES | ||
| Earnings-Quarterly | YES | ||
| Earnings-Long Term | YES | ||
| Earnings Outlook | YES | ||
| Industry Group | YES | ||
| Prior Breakout Success | YES | ||
| Fund Sponsorship | YES | ||
| Total Score | 12 | 0 | 2 |
Charts of Selected Breakout Stocks
|
TTD's Quality Rating of Stock - QFIN - AVERAGE |

|
TTD's Quality Rating of Stock - PGR - AVERAGE |
|
TTD's Quality Rating of Stock - OMC - AVERAGE |
|
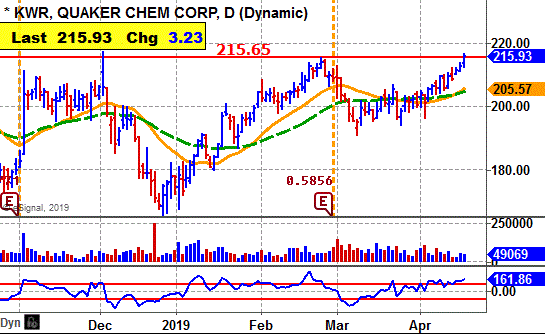
TTD's Quality Rating of Stock - KWR - AVERAGE |

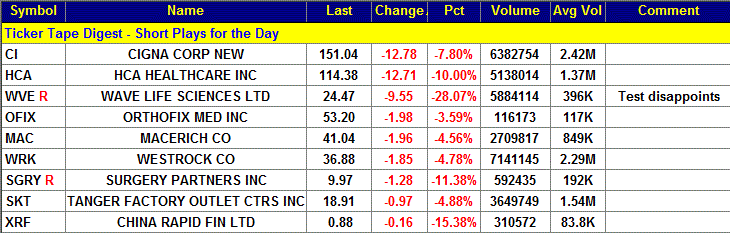
Ticker Tape Digest’s Daily List of “Stocks To Sell or Sell Short” ranks stocks well timed to be sold immediately based on daily trading. The list can be used as an alert to reduce current long-term positions.
Shorts from tape action so far today - 9
Stocks Screened - 12,234
Long-Term Environment for bears: Unfavorable.
Bear Side - Large list of breakdown stocks. Bears can be venturesome.
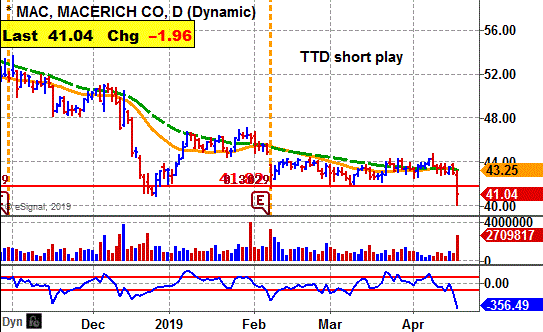
MAC, based in Santa Monica, Ca., is a self-administered and self-managed real estate investment trust. Annual revenues: $960 million. MAC's stock cuts below key support Tuesday with expanding volume. 
So far today, MAC is trading a heavy 2.7 million shares, triple its average daily volume of 849,000 shares.
TTD sees more on the downside. 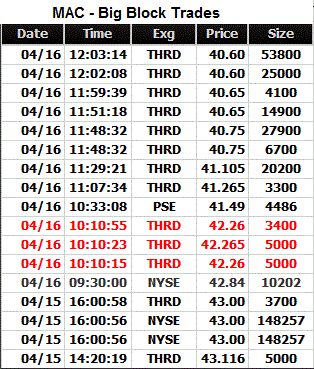
Tape Action
MAC's tape action shows the recent block trades.
One can see the price for the blocks falling from $43.11 in the prior session to as low as $40.60
A key bearish trade came late on Monday when a massive block of 148,257 shares (duplicated) crossed at $43.
That was down from the prior block at $43.11 on 5,000 shares.
Business
The company acquires and manages regional shopping centers in the U.S.
The company owns interests in the Macerich Partnership, L.P.
MAC has ownership interests in 51 million square feet of real estate consisting of 47 shopping centers.
Earnings:
This year, analysts are forecasting an 8% decline in net to $3.56 a share from the $3.85 the year before.
For the first quarter, the Street predicts a 2% drop in net to 80 cents a share from the 82 cents the year before.
Net for the second is expected to fall 10% to 86 cents a share from the 96 cents the year before.
Charts:
MAC's daily chart shows the stock breaking below key support with heavy volume. The move reinforces its down trend.
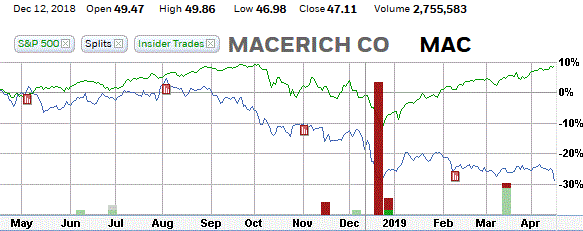
MAC's 12-month performance chart shows the stock down 28% versus a gain of 9% for the stock market.
Strategy Opinion: TTD is targeting MAC for a decline 35 within the next few months or sooner. A protective stop buy can be placed near $43.50.
Suitability: Conservative Bears.
TTD's probability research of Prior Performance:
Probability - Earnings Response - Bearish. - MAC rose 4 times after the past 10 earnings reports when there was a significant change in price.
Probability: Seasonal Activity - Bearish. - MAC averaged a decline of 2.5% in April and a decline of 1.7% in May the past several years.
|
TTD's Quality Rating of Stock - MAC - BELOW AVERAGE |
Stock's Performance Chart with Quarterly Earnings Markers vs. S&P 500
Insider Buying in Green - Insider Selling in Red
TTD columnist Leo Fasciocco has covered the stock market for over 30 years. His articles appear in many publications. He has also been a speaker at the Money Show conferences. He has been on television and radio. He is author of many educational articles about stock investing and the book “Guide To High-Performance Investing.”

For information to subscribe to the Ticker Tape Digest Services call: Beverly Owen at 1-480-878-8381 or 480-704-3331
Distributed by Corona Publishing Enterprises. TickerTape Digest Inc. 1220 W. Sherri, Gilbert, Az. 85233.
TTD “Professional Report” is available on the Web: $100 per month. Password needed. Published daily - around 20 times a month.
TTD Pro Report includes a Morning chart slide show of breakout stocks, a Midsession video-audio show with commentary on breakout stocks and shorts and a Final end of day overall report on breakout stocks for the session, short plays and accumulation plays. There are other features too such as Quick Trades and Long-term Plays.
TTD Daily Report is $39. It covers a Morning slide show of charts of stocks breaking out and a TTD end of day print report covering breakout stocks and shorts.
Credit cards accepted. Payable to Corona Publishing Enterprises.
(The information contained has been prepared from data deemed reliable but there is no guarantee of complete accuracy. Ticker Tape Digest Inc. is not affiliated with any broker, dealer or investment advisor. Nothing in this publication constitutes an offer, recommendation or solicitation to buy or sell any securities. Further research is advised. This report is copyrighted and no redistribution is permitted with out permission.)