Daily - Go to TTD's Chart scroller of Breakout and Leading Stocks - Friday, April 22, 2016
|
Daily - Go to TTD's Chart scroller of Breakout and Leading Stocks - Friday, April 22, 2016 |
|
Weekly - Bullish Conservative Investors - Go To TTD Long-Term Plays - Monday, April 18, 2016 |
|
Go to Video Show - "How to Make Money With Breakout Stocks" |
|---|

By Leo Fasciocco -- TTD
Ticker Tape Digest presents its daily stock market report containing stocks to go long as breakout trades, quick trades, or bargain trades. We also feature stocks under Significant Accumulation that are poised to breakout.
|
Ticker Tape Digest's Daily schedule guide for TTD subscribers 1. Pre-market - check Breakout Watch List and Quick Trades. 2. Morning - (11:30 - 12 A.M.) - check breakout stocks tape and breakout chart slide show. 3. Midday (1 P.M.) check TTD Midsession Report and see market video show. 4. After close (4 P.M.) check final TTD Report for day. Trading Strategies Bullish Aggressive Investors Bullish - "Breakout Stocks" - ideally suited for bull markets and special situation stocks. Potential for large returns. (See Performance) Aggressive Investor Bullish- "Quick Trade Stocks" -ideally suited for entry into top performing issues looking for a small quick profit." (See Performance) Conservative Investors "Bargain Buy Trades for the Long Term." Ideally suited for entry into top performing big cap stocks on pullbacks within overall up trend.(See Performance) Bearish Aggressive Bearish Investors - "Breakdown Stocks" to Sell Short. Ideally suited for bear markets or market pull backs. Potential for large returns (See Performance) |
|---|
The TTD report also contains stocks to short as breakdown plays and as bargain (swing trade) shorts.
Investors should tend to try to go with a strategy that fits with the stock market's trend, unless there is a special situation play.
TTD's Breakout Stocks - Long are
most suitable for aggressive investors seeking ideal entry points into leading stocks, especially during bull markets. They can do extremely well in bull markets with gains of as much as several hundred percent. 
These stocks can also do extremely well during strong market rallies, or if they are in a industry group that is performing very well. They tend to have strong earnings outlooks and are near new-52 week, or all-time highs.
TTD Quick Trade Stocks - Long These are leading issues that have pulled back in recent days, but could move higher soon. They are most suitable for Aggressive Investors willing to trade short term. These stocks will do extremely well during market advances. They have about 74% win rate. During market rally sequences the win rate is even higher. The return is small 3% to 8% in just a few days.
TTD's Bargain Buy Trades - Long - Long Term. These are for conservative bullish Investors These long-term buys are ideally suited for entry into stocks on pull backs within overall up trend. These stocks can give a good return long-term especially during a bull market.
TTD also presents Stocks To Sell or Sell Short. These issues are suitable for aggressive investors willing to take short positions both as trades or for longer-term plays. These stocks will do very well during bear markets or market pull backs.
TTD's Bearish breakdown stocks to sell short. These issues have potential to fall sharply. They often show a technical breakdown and also some fundamental business problem such as weak earnings.
TTD's multi-media updates include a slide-show that presents charts and analysis at midsession. Some times TTD presents feature analysis on stocks and the market. TTD uses Windows Media Files. (WMV).
TTD also presents a "Breakout Watch List" that is up dated daily. This list consists of key stocks in position to breakout. A close watch of this list can put you in the stock just as it breaks out. A good idea is to study the list and be ready to move into a stock quickly as it hits its breakpoint.
TTD often suggests using stop buy orders to enter. It is very important to buy a breakout stock as close as possible to the breakpoint. The idea is to get "elbow room" if the stock should follow through to the upside. This is very important in being successful in making big money with breakout stocks.
It is also essential to have a stop loss strategy for all stocks in which positions are taken. Not every stock will work as expected. It is important for investors to "police" their portfolios and avoid getting trapped in any bad positions.
Quality rating of breakout Two key factors: 1 - Stock near all-time high in price or near a 52-week high. 2 - earnings growth current year is strong. The ideal play is a stock with an Above Average Quality Rating. The stock is near a new high and will have strong earnings. TTD's other ratings are Average and Below Average.
TTD also has special feature sections on Educational Tips on Investing.
To email Mr. Leo Fasciocco leo@tickertapedigest.com.For service, email Beverly Owen owen@tickertapedigest.com. TTD’s Tel: 1-480-926-1680.
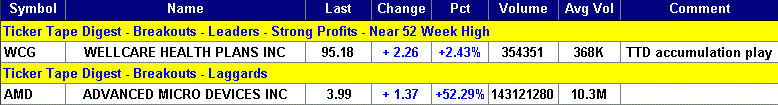
Breakout Stocks
Total Buy Breakouts so far today - 2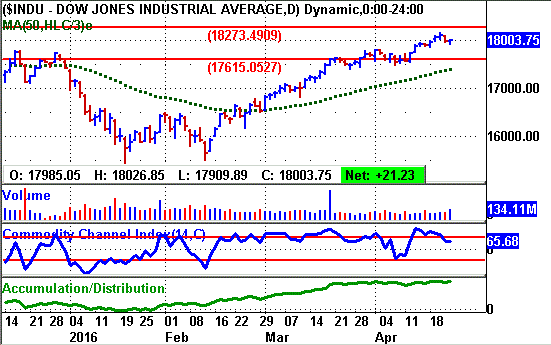
Overall Quality of Breakouts - AVERAGE
Stocks Screened - 8,300
Bull side - Breakout list small. Bulls be conservative. Stock market now pulling back after recent strong run up.
(Put mouse on Dow chart to see Nasdaq chart)
Long Term Environment for bulls: Neutral
Stock Market Momentum
Market (Daily) - NYSE Bearish, Nasdaq Bearish
Market (Weekly) - NYSE Bullish, Nasdaq Bullish
Market (Monthly) - NYSE Bullish, Nasdaq Bullish
Ticker Tape Digest's
|
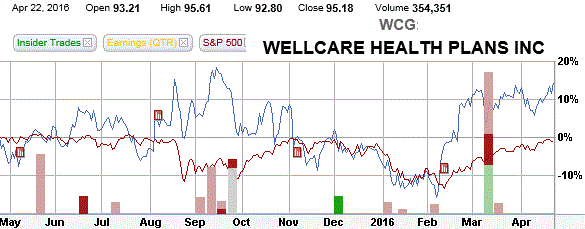
TTD's Quality Rating of Stock - WCG - ABOVE AVERAGE |
WCG, based in Tampa, Fla., provides managed care services for government-sponsored health care programs. Annual revenues: $13.9 billion. WCG's stock breaks out Friday from an eight-week flat base. The move carries the stock close to an eight year high.
TTD recently featured WCG as a stock to accumulate as a potential breakout.
So far today, WCG is trading 354,351 shares. Its average daily volume is 368,000 shares. 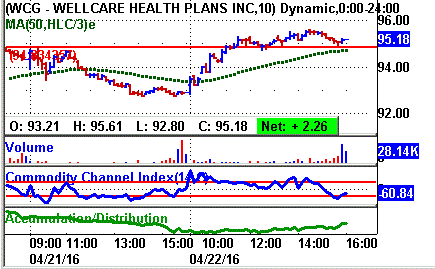
WCG's stock pushed higher in the morning and cleared its breakpoint line. The stock then hugged the line for a few hours.
Then in the afternoon it cleared the break point line and held above to the final bell.
WCG's tape action shows the recent block trades.
One can see the price for the blocks climbing from $92.92 Thursday to as high as $95.44 Friday.
A key bullish trade came Friday morning when a block of 5,300 shares crossed the tape at $94.44.
That was up from a prior block in the prior sequence at $92.92 on 20,662 shares (duplicated).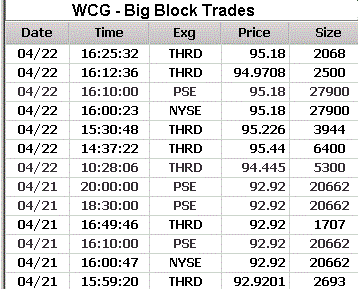
WCG operates through three segments: Medicaid Health Plans, Medicare Health Plans, and Medicare PDPs.
The Medicaid Health Plans segment offers plans for beneficiaries of temporary assistance for needy families, supplemental security income, and aged blind and disabled residents and other state-based programs, such as children's health insurance programs for qualifying families.
The Medicare Health Plans provides Medicare, a federal program that provides eligible persons aged 65 and over, as well as some disabled persons with hospital, medical, and prescription drug benefits.
Medicare Advantage, a Medicare managed care alternative to the original Medicare program, offers individuals standard Medicare benefits directly through Centers for Medicare & Medicaid Services and coordinated care plans.
WCG's 12-month performance chart shows the stock appreciating 13% versus a 1% decline for the stock market.
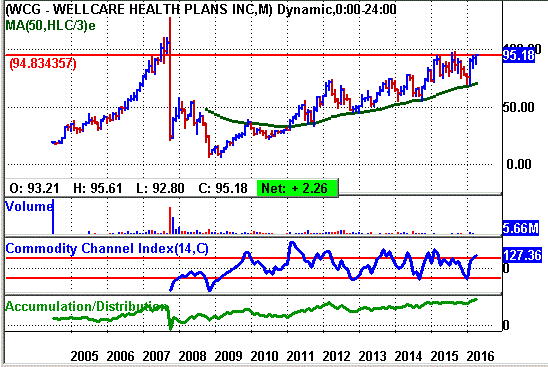
WCG's stock came public in 2004 and traded at $19.30. The stock climbed to an all-time peak of 128.42 in 2007, the top in the prior bull market.
The stock fell hard during the bear market sinking to $6.12 in 2008. It has since worked
steadily higher the past seven years. (see long-term chart) 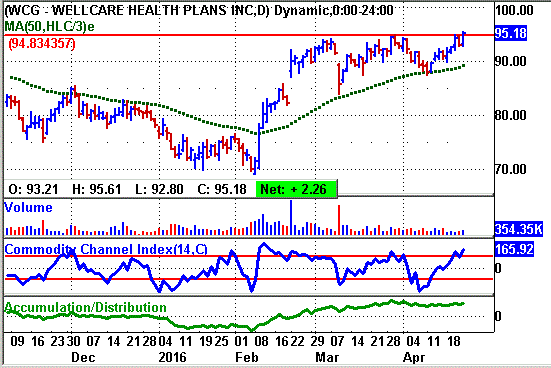
WCG's daily chart shows the stock bottoming around 70 in February after the big market sell off early in the year.
The stock then climbed to 94 and formed a flat base above its rising 50-day moving average line.
The stock just clears the breakpoint line Friday.
WCG's CCI momentum indicator (bottom of chart) is trending higher.
The accumulation - distribution line is trending sideways.
This year, analysts are forecasting a 31% jump in profits to $4.50 a share from $3.44 in 2015.
The stock sells with a price-earnings ratio of 21. TTD sees that as attractive to value investors.
Going out to 2017, the Street projects a 22% gain in net to $5.48 a share from the anticipated $4.50 this year.
Net for the upcoming first quarter is expected to surge 44% to 71 cents a share from 49 cents
a year before.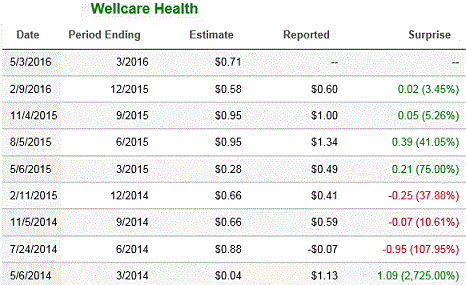
The highest estimate on the Street is at 80 cents a share.
TTD sees very good chances for an upside earnings surprise.
WCG topped the Street consensus the past four quarters by 2 cents a share, 5 cents, 39 cents and 21 cents. (See table).
For the second quarter, profits are projected to rise a more modest 7% to $1.44 a share from $1.34 a year before.
Strategy Opinion: TTD is targeting WCG for a move to 113.
A protective stop can be placed near 90.
TTD rates WCG a good intermediate-term play provided earnings meet expectations.
Sponsorship: Excellent. The largest fund buyer recently was the 4-star rated VA CollegeAmerica Growth Fund of America 528F which purchased 1.2 million shares. It has 2.7% stake. The largest of all fund holders.
Also, the T. Rowe Price Health Sciences Fund, 5-star rated, was a recent buyer of 36,200 shares. It has a 2.3% stake.
WCG has 44.3 million shares outstanding. Institutions hold 90% of the stock and insiders have 1%.
Currently, 15 analysts follow the stock, 6 have a buy, up from 5 three months ago. JP Morgan upgraded the stock in February.
Insider Activity: Neutral. Light insider selling recently around $93.
WCG has a book value of $39.18 a share.
Stock Performance Chart with Quarterly Earnings Markers.
| TTD's Breakout Profile
Rating Wellcare Health Plans Inc. - (WCG) |
| TTD Check List | Bullish | Bearish | Neutral |
| Near 52-week High | YES | ||
| Volume | YES | ||
| Tick Volume | YES | ||
| Price Trend - Daily | YES | ||
| Price Trend - Long Term | YES | ||
| Price Daily Spread | YES | ||
| Base Structure | YES | ||
| Base - A-D | YES | ||
| Earnings-Quarterly | YES | ||
| Earnings-Long Term | YES | ||
| Earnings Outlook | YES | ||
| Industry Group | YES | ||
| Prior Breakout Success | YES | ||
| Fund Sponsorship | YES | ||
| Total Score | 13 | 0 | 1 |
Charts of Selected Breakout Stocks
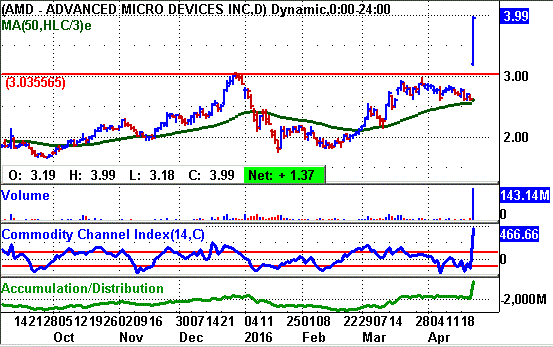
| TTD's Quality Rating of Stock - AMD - BELOW AVERAGE |

Ticker Tape Digest’s Daily List of “Stocks To Sell or Sell Short” ranks stocks well timed to be sold immediately based on daily trading. The list can be used as an alert to reduce current long-term positions.
Shorts from tape action so far today - 5
Stocks Screened - 8,300
Long-Term Environment for bears: Neutral.
Bear Side - Small list of breakdown stocks Friday, but some interesting plays. Stock market now in a near-term pull back phase.
TTD's short from Thursday was Natural Grocers (NGVC) at 13.69. Today, NGVC falls to 12.35 and is working well for bears.
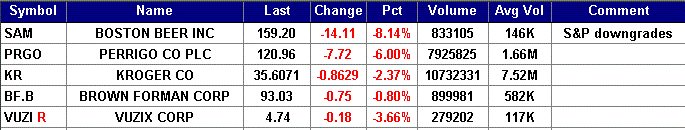
SAM, based in Boston, produces and sells alcohol beverages in the U.S. Annual revenues: $959 million. SAM's stock falls sharply Friday. The drop was due to disappointing earnings for the first quarter. TTD sees more on the downside. 
TTD highlighted SAM as a short at our midsession video show on the Web Friday.
SAM came in with first quarter net of 53 cents a share.
That was well below the 96 cents expected by the Street.
SAM's stock fell sharply in the morning touching an intraday low of 151.85.
The stock then lifted a bit and trended sideways the rest of the day.
SAM's tape action shows the recent block trades.
One can see the price for the blocks falling from $173.31 in the prior session to as low as $152.44 Friday.
The company's leading beer is Samuel Adams Boston Lager. It sells 60 beers under the Samuel Adams or the Sam Adams brands. It also sells 12 flavored malt beverages under the Twisted Tea brand and 10 hard cider beverages under the brand Angry Orchard brand and 40 beers under various Alchemy & Science trade names.
This year, analysts were forecasting an 8% increase in net. However, that estimate may come down.
SAM's daily chart shows the stock gapping lower Friday on big volume. The stock's CCI momentum indicator (bottom of chart) is strongly bearish.
Strategy Opinion: TTD is targeting SAM for a decline to 138 within the next few months, or sooner. A protective stop buy can be placed near 170 giving it room.
| TTD's Quality Rating of Stock - SAM - BELOW AVERAGE |

TTD columnist Leo Fasciocco has covered the stock market for over 20 years. His articles appear in many publications. He is also a speaker at the Intershow conferences. He has been on television and radio. He is author of many educational articles about stock investing and the book “Guide To High-Performance Investing.”

For information to subscribe to the Ticker Tape Digest Services call: Beverly Owen at 1-480-926-1680. Distributed by Corona Publishing Enterprises. Ticker Tape Digest Inc. P.O. Box 2044 Chandler, Az. 85244-2044. TTD “Professional Report” is available on the World Wide Web: $100 per month. Password needed. “TTD Professional“ Faxed is $200 per month. The TTD Daily Report is $39.95. Credit cards accepted.
(The information contained has been prepared from data deemed reliable but there is no guarantee of complete accuracy. Ticker Tape Digest Inc. is not affiliated with any broker, dealer or investment advisor. Nothing in this publication constitutes an offer, recommendation or solicitation to buy or sell any securities. Further research is advised. This report is copyrighted and no redistribution is permitted with out permission.)