![]()
|
|
|
|
|
Go to Video Show - "How to Make Money With Breakout Stocks |
|---|

By Leo Fasciocco -- TTD
Ticker Tape Digest presents its daily stock market report containing stocks to go long as Breakout Trades, Quick Trades, or Bargain Accumulation Trades.
We also feature stocks under Significant Accumulation that are poised to breakout.
|
Ticker Tape Digest's Daily schedule guide for TTD subscribers 1. Pre-market - check Breakout Watch List and Quick Trades. 2. Morning - (11:30 - 12 A.M.) - check breakout stocks tape and breakout chart slide show. 3. Midday (1 P.M.) check TTD Midsession Report and see market video show. 4. After close (4 P.M.) check final TTD Report for day. Trading Strategies Bullish Aggressive Investors Bullish - "Breakout Stocks" - ideally suited for bull markets and special situation stocks. Potential for large returns. (See Performance) Aggressive Investor Bullish- "Quick Trade Stocks" -ideally suited for entry into top performing issues looking for a small quick profit." (See Performance) Conservative Investors "Bargain Buy Trades for the Long Term." Ideally suited for entry into top performing big cap stocks on pullbacks within overall up trend.(See Performance) Bearish Aggressive Bearish Investors - "Breakdown Stocks" to Sell Short. Ideally suited for bear markets or market pull backs. Potential for large returns (See Performance) |
|---|
The TTD report also contains stocks to short as breakdown plays and as bargain (swing trade) shorts.
Investors should tend to try to go with a strategy that fits with the stock market's trend, unless there is a special situation play.
TTD's Breakout Stocks - Long are
most suitable for aggressive investors seeking ideal entry points into leading stocks, especially during bull markets. They can do extremely well in bull markets with gains of as much as several hundred percent. 
These stocks can also do extremely well during strong market rallies, or if they are in a industry group that is performing very well. They tend to have strong earnings outlooks and are near new-52 week, or all-time highs.
TTD Quick Trade Stocks - Long These are leading issues that have pulled back in recent days, but could move higher soon. They are most suitable for Aggressive Investors willing to trade short term. These stocks will do extremely well during market advances. They have about 74% win rate. During market rally sequences the win rate is even higher. The return is small 3% to 8% in just a few days.
TTD's Bargain Buy Trades - Long - Long Term. These are for conservative bullish Investors These long-term buys are ideally suited for entry into stocks on pull backs within overall up trend. These stocks can give a good return long-term especially during a bull market.
TTD also presents Stocks To Sell or Sell Short. These issues are suitable for aggressive investors willing to take short positions both as trades or for longer-term plays. These stocks will do very well during bear markets or market pull backs.
TTD's Bearish breakdown stocks to sell short. These issues have potential to fall sharply. They often show a technical breakdown and also some fundamental business problem such as weak earnings.
TTD's multi-media updates include a slide-show that presents charts and analysis at midsession. Some times TTD presents feature analysis on stocks and the market. TTD uses Windows Media Files. (WMV).
TTD also presents a "Breakout Watch List" that is up dated daily. This list consists of key stocks in position to breakout. A close watch of this list can put you in the stock just as it breaks out. A good idea is to study the list and be ready to move into a stock quickly as it hits its breakpoint.
TTD often suggests using stop buy orders to enter. It is very important to buy a breakout stock as close as possible to the breakpoint. The idea is to get "elbow room" if the stock should follow through to the upside. This is very important in being successful in making big money with breakout stocks.
It is also essential to have a stop loss strategy for all stocks in which positions are taken. Not every stock will work as expected. It is important for investors to "police" their portfolios and avoid getting trapped in any bad positions.
Quality rating of breakout Two key factors: 1 - Stock near all-time high in price or near a 52-week high. 2 - earnings growth current year is strong. The ideal play is a stock with an Above Average Quality Rating. The stock is near a new high and will have strong earnings. TTD's other ratings are Average and Below Average.
TTD also has special feature sections on Educational Tips on Investing.
To email Mr. Leo Fasciocco leo@tickertapedigest.com.
For service, email Beverly Owen owen@tickertapedigest.com. TTDÆs Tel: 1-480-878-8381 or 480-704-3331.
Friday - April 24, 2020
TTD's Breakout Stocks
Stock Market Overview
Total Buy Breakouts - 4
Quality of Breakouts - Average.
Stocks Screened - 12,234
Bull side - Small list of breakouts even though market rallies strongly.
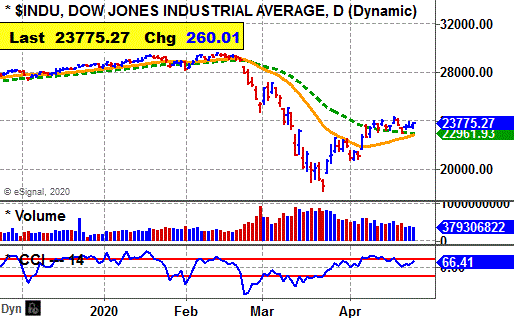
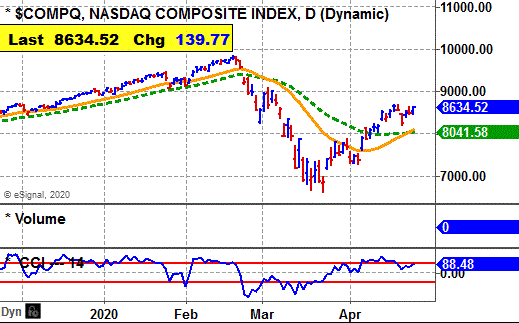
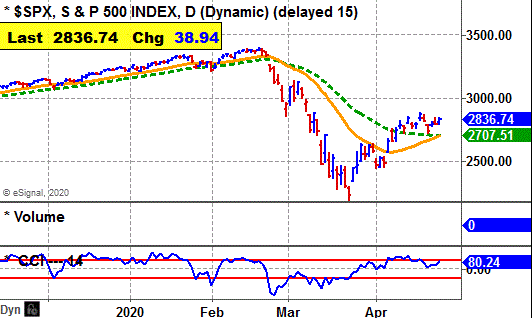
Stock market - Major averages remain bullish daily. However, weekly and Monthly are bearish, except for the Nasdaq.
Comment - Small list of breakouts but some interesting plays. Earnings will now dominate the news. Bulls need to be alert.
See Latest Earnings Reports - A company that tops the Street's highest earnings estimate has potential to go higher. Key earnings beats - ALV, CZFS, SNY, AXP and VZ.
Stock Market Momentum
(Daily is based on a moving average)
|
Market (Daily) |
Market (Weekly) |
Market (Monthly) |
|
Dow - Bullish |
Dow - Bearish |
Dow - Bearish |
|
Nasdaq - Bullish |
Nasdaq - Bullish |
Nasdaq - Bullish |
|
S&P 500 - Bullish |
S&P 500 - Bearish |
S&P 500 - Bearish |
 Ticker Tape Digest's
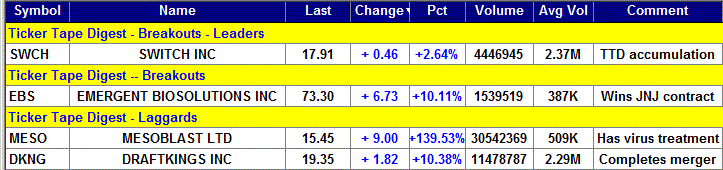
|
TTD's Quality Rating of Stock - SWCH - ABOVE AVERAGE |
SWCH, based in Las Vegas, designs and constructs data centers. Annual revenues: $462 million. SWCH's stock moves higher Friday and breaks out from its 10- week, cup-and-handle base. 
So far today, SWCH is trading is trading a heavy 4.4 million shares. Its average daily volume is 2.4 million shares.
TTD featured SWCH earlier in the week as a stock to accumulate in anticipation of a breakout.
SWCH's stock moved higher in the morning and worked higher through the session.
It cleared its breakpoint late in the day. In after-hours trading the stock rose another 0.19.
The close on a high is very bullish for a positive opening on Monday. 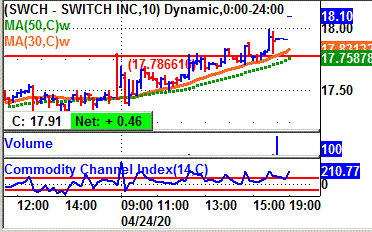
Tape Action
SWCH's tape action shows the recent block trades.
One can see the price for the blocks climbing from $17.45 in the prior session to as high as $17.95 Friday afternoon.
A key bullish trade came in the morning when a block of 6,095 shares (duplicated) crossed the tape at $17.55.
That was up from the prior block at $17.45 on 90,145 shares late on Thursday.
Near the close a big block of 550,655 shares crossed at $17.91.
That was up from the prior trade at $17.90 on 100 shares.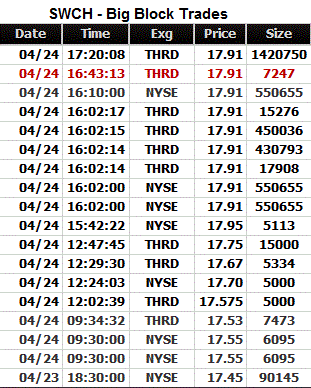
Business
SWCH is a developer and operator of the SUPERNAP, data center facilities, and provides colocation, telecommunications, cloud services, and content ecosystems.
The company's technologies include 100% hot aisle containment rows, exterior wall penetrating multi-mode HVAC units and hot and cold containment segregation structure.
It also includes redundant data center roofing system, multi-system power containers, data center infrastructure management system
Charts
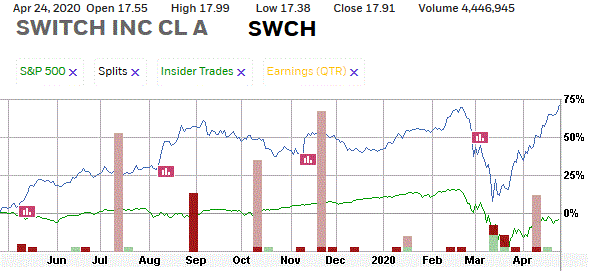
SWCH's 12-month performance chart shows the stock up 70% versus a 5% decline for the stock market.
Insiders were buyers of options this year. The price was not disclosed.
They were sellers at $11 to 14 a shares.
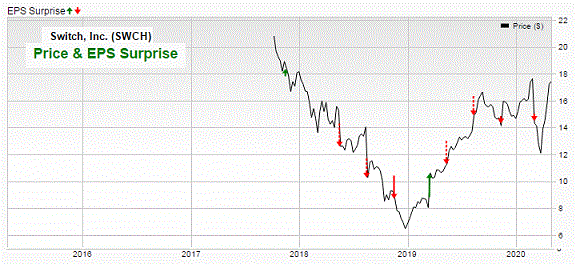
SWCH's long-term chart shows the stock coming public at $19.16 in 2017. The stock fell back to $6.39 by late 2018.
However, since then SWCH has rallied strongly. It is within range to make a new all-time high. That would be bullish.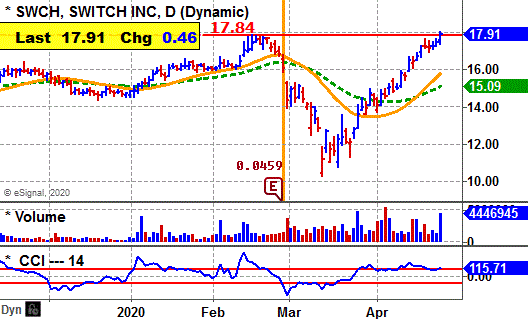 It needs to top $19.73.
SWCH's daily chart shows the stock forming a classic cup-and-handle basing pattern.
The stock moved to the top of the base and now breaks out with good volume.
The spread is not that great. So, one needs to be watchful . A follow through move to the upside would be ideal.
SWHC's CCI momentum indicator is bullish.
Earnings Outlook
This year, analysts predict a big 91% surge in net to 21 cents a share from the 11 cents the prior year.
The stock sells with a price-earnings ratio of 81. That is high but okay given the earnings growth rate.
Looking out to 2021, the Street predicts a 20% increase in net to 25 cents a share from the anticipated 21 cents this year.
Net for the first quarter should leap 150% to 5 cents a share from the 2 cents the prior year.
Four analysts track stock.
Net for the second quarter should be up 50% to 6 cents a share from the 4 cents the previous year.
Strategy Opinion: TTD is targeting SWCH for a move to $234. A protective stop can be placed near $16 after a breakout.
Intermediate-Term Rating: Average.
Suitability: Aggressive Bulls.
TTD's special research of Stock's Prior Performance:
|
Breakout Success |
Bullish |
SWCH scored a good gain off a recent breakout. |
|
Response to Net |
Bearish |
SWCH rose 2 times after 6 earnings reports. |
|
Seasonal Success |
Bullish |
SWCH avg. gain 5.3% in April, 0.0% in May in prior years. |
|
Earnings Beats |
Bearish |
SWCH beat Street net estimate 2 times after 10 reports. |
Stock's Prior Performance After A Breakout
|
Stock's % Change from Breakout to peak - prior to cut below 50-day M/A. |
Date of Breakout |
Break point Price |
Stocks Price Peak after Breakout - prior to cut below 50-day M/A |
Date Trade Closed |
|
4% |
2/11/2020 | 16.77 | 17.40 | 2/14/2020 |
|
50% |
5/10/2019 | 11.17 | 16.78 | 9/5/2019 |
(In actual trading, entry and exit points could vary depending on broker execution.
Also, ideal are breakouts to a new 52-week high or better, perhaps all-time highs.)
Stock's Long-term Chart

Stock's Price Performance after Reporting Earnings
Stock's Performance Chart with Quarterly Earnings Markers vs. S&P 500
Insider Buying in Green - Insider Selling in Red
Charts of Selected Breakout Stocks
|
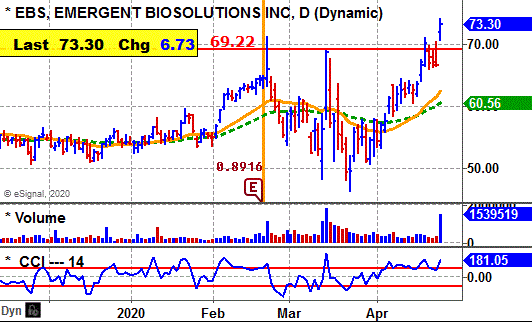
TTD's Quality Rating of Stock - EBS - AVERAGE |
|
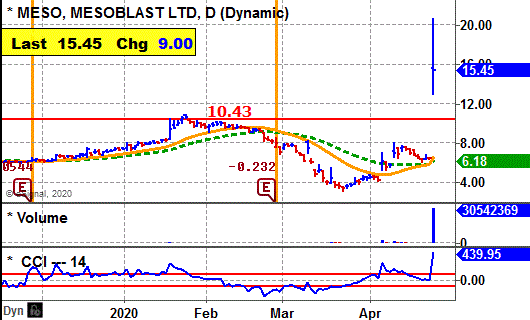
TTD's Quality Rating of Stock - MESO - BELOW AVERAGE |
|
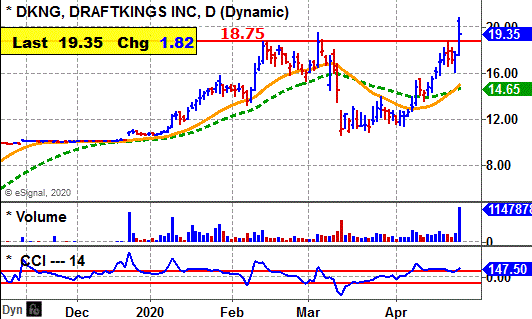
TTD's Quality Rating of Stock - DKNG - BELOW AVERAGE |

Ticker Tape DigestÆs Daily List of ōStocks To Sell or Sell Shortö ranks stocks well timed to be sold immediately based on daily trading. The list can be used as an alert to reduce current long-term positions.
Shorts from tape action - 7
Stocks Screened - 12,234
Long-Term Environment for bears: Neutral.
Bear Side - Large list of shorts Friday. Stock market still consolidating after recent bounce rally. Bears remain alert as earnings will now be reported.
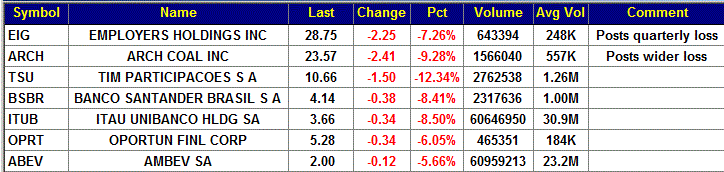
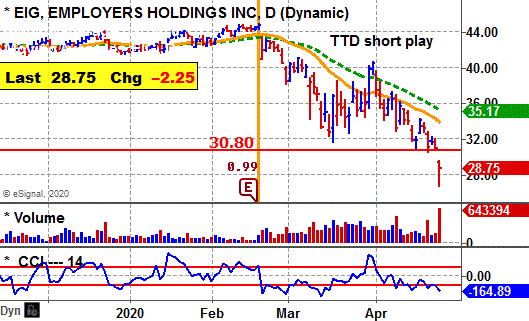
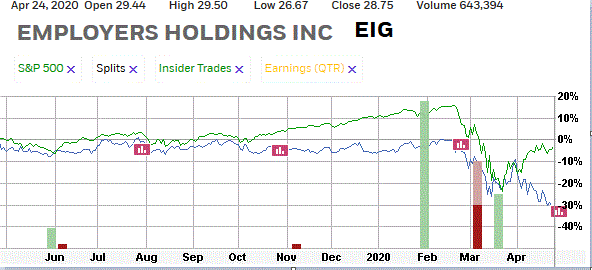
EIG, based in Reno, Nev., through its insurance subsidiaries provides workers' compensation insurance coverage to small businesses in low to medium hazard industries. Annual revenues: $701 million. EIG's stock falls sharply Friday and undercuts key technical support. 
So far today, EIG is trading a heavy 643,394 shares, almost triple its average daily volume of 248,000 shares.
The stock's decline was triggered when the company reported a loss for the first quarter
TTD highlighted EIG as a short at our midsession video show on the Web Friday. 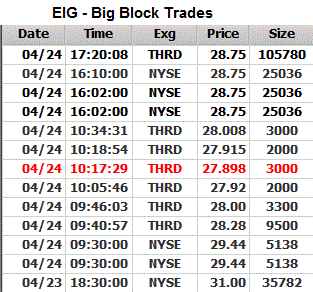
The company reported a loss for the first quarter of $1.14 a share. The company cited investment loss as impacting results.
EIG's stock gapped lower in the morning and undercut support. It touched an intraday low of $26.67.
The stock then worked higher the rest of the day to cut its loss.
Tape Action
EIG's tape action shows the recent block trades.
One can see the price for the blocks falling from $31 in the prior session to as low as $27.89 in the morning.
A key bearish trade came at the opening when a block of 5,138 shares (duplicated) crossed the tape at $29.44.
That was down from the prior block at $31 on 35,782 shares in the prior session.
Business
EIG provides workers' compensation insurance under a statutory system wherein employers are required to provide coverage for their employees' medical, disability, vocational rehabilitation, and/or death benefit costs for work-related injuries or illnesses.
The company provided workers' compensation insurance in 36 states with a concentration in California.
Earnings:
This year, analysts were forecasting a 50% drop in net to $1.80 a share from the $3.20 the prior year. That estimate could come down.
For the second quarter, the Street predicts a 61% plunge in net to 35 cents a share from 90 cents the previous year.
Charts:
EIG's daily chart shows the stock trending lower from $45 in February down to around $31 where it tried to form a bottom However, the stock gaps below support on big volume.
EIG's 12-month performance chart shows the stock down 39% versus a 5% drop in the stock market.
Insiders have been getting stock options. The price was not disclosed. Earlier in the year, they were sellers at $42 after executing options at $22.
Strategy Opinion: TTD is targeting EIG for a decline to $24 within the next few months. A protective stop buy can be placed near $30.50.
Suitability: Aggressive Bears.
TTD's Stock Probability research of Prior Performance:
|
Response to Net |
Bullish |
EIG rose 10 times after 15 earnings reports. |
|
Seasonal Success |
Bearish |
EIG fell 2% in April, fell 1% in May in prior years. |
|
Earnings Beats |
Bullish |
EIG beat Street estimate 17 times after 20 reports. |
|
TTD's Quality Rating of Stock - EIG - BELOW AVERAGE |
Stock's Performance Chart with Quarterly Earnings Markers vs. S&P 500
Insider Buying in Green - Insider Selling in Red
TTD columnist Leo Fasciocco has covered the stock market for over 30 years. His articles appear in many publications. He has also been a speaker at the Money Show conferences. He has been on television and radio. He is author of many educational articles about stock investing and the book ōGuide To High-Performance Investing.ö

For information to subscribe to the Ticker Tape Digest Services call: Beverly Owen at 1-480-878-8381.
Distributed by Corona Publishing Enterprises. TickerTape Digest Inc. 1220 W. Sherri, Gilbert, Az. 85233.
TTD ōProfessional Reportö is available on the Web: $100 per month. Password needed. Published daily - around 20 times a month.
TTD Pro Report includes a Morning chart slide show of breakout stocks, a Midsession video-audio show with commentary on breakout stocks and shorts and a Final end of day overall report on breakout stocks for the session, short plays and accumulation plays. There are other features too such as Quick Trades and Long-term Plays.
TTD Daily Report is $39. It covers a Morning slide show of charts of stocks breaking out and a TTD end of day print report covering breakout stocks and shorts.
Credit cards accepted. Payable to Corona Publishing Enterprises.
(The information contained has been prepared from data deemed reliable but there is no guarantee of complete accuracy. Ticker Tape Digest Inc. is not affiliated with any broker, dealer or investment advisor. Nothing in this publication constitutes an offer, recommendation or solicitation to buy or sell any securities. Further research is advised. This report is copyrighted and no redistribution is permitted with out permission.)