![]()
|
|
|
Weekly - Bullish Conservative Investors - Go To TTD Long-Term Plays - Monday, Aprl 22, 2019 |
|
|
Go to Video Show - "How to Make Money With Breakout Stocks |
|---|

By Leo Fasciocco -- TTD
Ticker Tape Digest presents its daily stock market report containing stocks to go long as Breakout Trades, Quick Trades, or Bargain Accumulation Trades.
We also feature stocks under Significant Accumulation that are poised to breakout.
|
Ticker Tape Digest's Daily schedule guide for TTD subscribers 1. Pre-market - check Breakout Watch List and Quick Trades. 2. Morning - (11:30 - 12 A.M.) - check breakout stocks tape and breakout chart slide show. 3. Midday (1 P.M.) check TTD Midsession Report and see market video show. 4. After close (4 P.M.) check final TTD Report for day. Trading Strategies Bullish Aggressive Investors Bullish - "Breakout Stocks" - ideally suited for bull markets and special situation stocks. Potential for large returns. (See Performance) Aggressive Investor Bullish- "Quick Trade Stocks" -ideally suited for entry into top performing issues looking for a small quick profit." (See Performance) Conservative Investors "Bargain Buy Trades for the Long Term." Ideally suited for entry into top performing big cap stocks on pullbacks within overall up trend.(See Performance) Bearish Aggressive Bearish Investors - "Breakdown Stocks" to Sell Short. Ideally suited for bear markets or market pull backs. Potential for large returns (See Performance) |
|---|
The TTD report also contains stocks to short as breakdown plays and as bargain (swing trade) shorts.
Investors should tend to try to go with a strategy that fits with the stock market's trend, unless there is a special situation play.
TTD's Breakout Stocks - Long are
most suitable for aggressive investors seeking ideal entry points into leading stocks, especially during bull markets. They can do extremely well in bull markets with gains of as much as several hundred percent. 
These stocks can also do extremely well during strong market rallies, or if they are in a industry group that is performing very well. They tend to have strong earnings outlooks and are near new-52 week, or all-time highs.
TTD Quick Trade Stocks - Long These are leading issues that have pulled back in recent days, but could move higher soon. They are most suitable for Aggressive Investors willing to trade short term. These stocks will do extremely well during market advances. They have about 74% win rate. During market rally sequences the win rate is even higher. The return is small 3% to 8% in just a few days.
TTD's Bargain Buy Trades - Long - Long Term. These are for conservative bullish Investors These long-term buys are ideally suited for entry into stocks on pull backs within overall up trend. These stocks can give a good return long-term especially during a bull market.
TTD also presents Stocks To Sell or Sell Short. These issues are suitable for aggressive investors willing to take short positions both as trades or for longer-term plays. These stocks will do very well during bear markets or market pull backs.
TTD's Bearish breakdown stocks to sell short. These issues have potential to fall sharply. They often show a technical breakdown and also some fundamental business problem such as weak earnings.
TTD's multi-media updates include a slide-show that presents charts and analysis at midsession. Some times TTD presents feature analysis on stocks and the market. TTD uses Windows Media Files. (WMV).
TTD also presents a "Breakout Watch List" that is up dated daily. This list consists of key stocks in position to breakout. A close watch of this list can put you in the stock just as it breaks out. A good idea is to study the list and be ready to move into a stock quickly as it hits its breakpoint.
TTD often suggests using stop buy orders to enter. It is very important to buy a breakout stock as close as possible to the breakpoint. The idea is to get "elbow room" if the stock should follow through to the upside. This is very important in being successful in making big money with breakout stocks.
It is also essential to have a stop loss strategy for all stocks in which positions are taken. Not every stock will work as expected. It is important for investors to "police" their portfolios and avoid getting trapped in any bad positions.
Quality rating of breakout Two key factors: 1 - Stock near all-time high in price or near a 52-week high. 2 - earnings growth current year is strong. The ideal play is a stock with an Above Average Quality Rating. The stock is near a new high and will have strong earnings. TTD's other ratings are Average and Below Average.
TTD also has special feature sections on Educational Tips on Investing.
To email Mr. Leo Fasciocco leo@tickertapedigest.com.
For service, email Beverly Owen owen@tickertapedigest.com. TTD’s Tel: 1-480-926-1680.
Friday - April 26, 2019
TTD's Breakout Stocks
Stock Market Overview
Total Buy Breakouts so far today - 14
Quality of Breakouts - Above Average
Stocks Screened - 12,234
Bull side - Large list of breakouts with some good looking plays. Aggressive bulls can be venturesome.
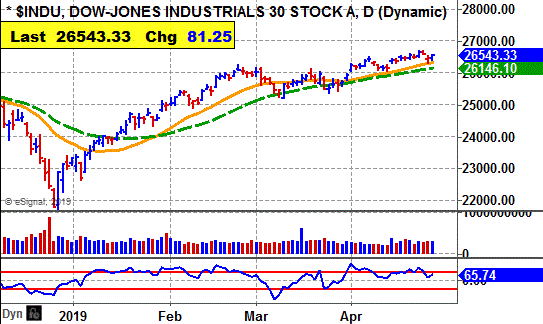
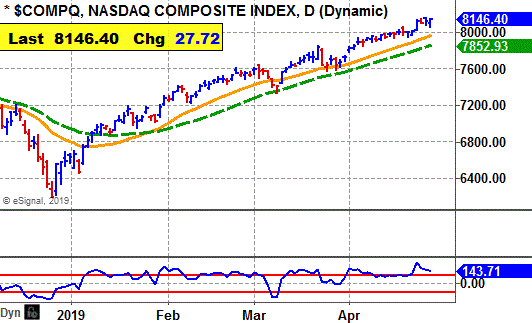
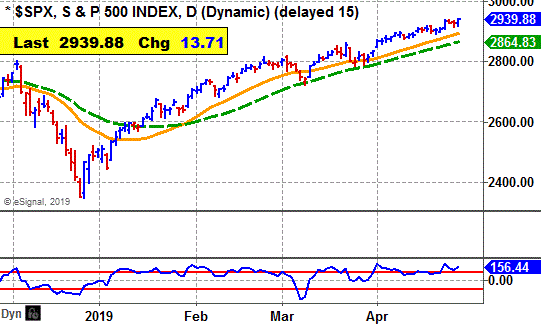
Stock market - Market averages remain bullish in all time sectors.
Comment - TTD sees the next few weeks as volatile as earnings begin to pour in.
See Latest Earnings Reports - A company that tops the Street's highest earnings estimate has potential to go higher. Some earnings beats for Friday - VLRS, HELE, AIMC, SNE, AN, BLMN, OPY and IPG.
Stock Market Momentum
(Daily is based on a moving average)
|
Market (Daily) |
Market (Weekly) |
Market (Monthly) |
|
Dow - Bullish |
Dow - Bullish |
Dow - Bullish |
|
Nasdaq - Bullish |
Nasdaq - Bullish |
Nasdaq - Bullish |
|
S&P 500 - Bullish |
S&P 500 - Bullish |
S&P 500 - Bullish |
 Ticker Tape Digest's
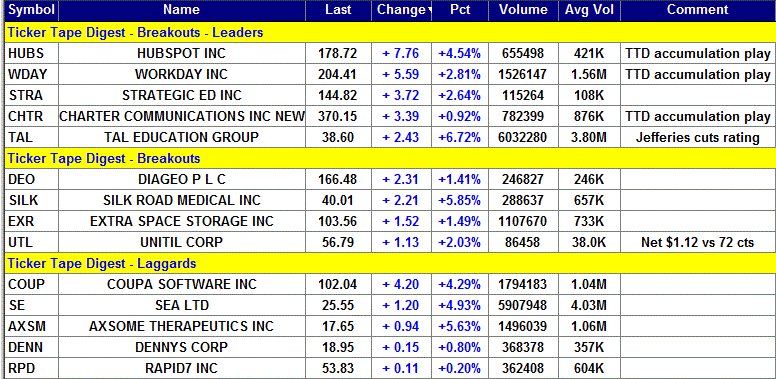
|
TTD's Quality Rating of Stock - HUBS - ABOVE AVERAGE |
HUBS, based in Cambridge, Ma., provides a cloud-based marketing and sales software platform. Annual revenues: $513 million. HUBS's stock drives higher Friday and breaks out from its 11-week flat base.
The move carries the stock closed to a new all-time high. The stock's all-time high is $180 set earlier this year. HUBS reached a high of $179.98 Friday.
TTD featured HUBS as a potential breakout on Thursday. TTD sees more on the upside.
So far today, HUBS is trading 655,498 shares. Its average daily volume is 421,000 shares.
HUBS's stock moved higher in the morning and cleared its breakpoint line. 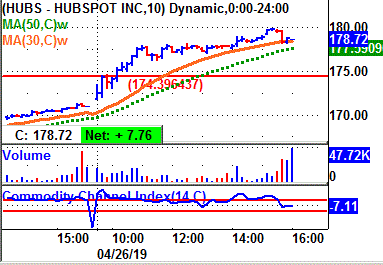
The stock then trended sideways through midday.
Late in the session, it lifted to high for the day and then gave a little ground.
Tape Action
HUBS's tape action shows the recent block trades.
One can see the price for the blocks climbing from $170.96 in the prior session to as high as $178.72 near Friday's close.
A key bullish trade came in the morning when a block of 4,186 shares crossed the tape at $171.80.
That was up from the prior block the day before at $170.96 on 2,038 shares. 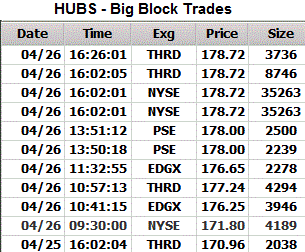
Business
HUBS's software platform features integrated applications to help businesses attract visitors to their Websites, convert visitors into leads and close leads into customers.
The integrated applications include social media, search engine optimization, blogging, Website content management, marketing automation, e-mail, sales, customer relationship management and analytics.
The Company's products include HubSpot Marketing, HubSpot CRM and HubSpot Sales.
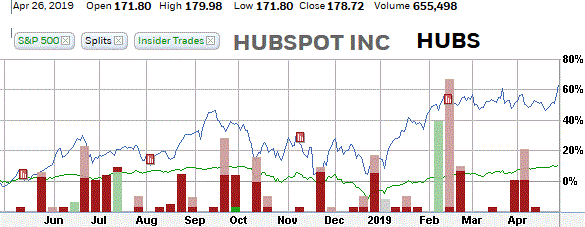
HUBS insiders were recent buyers using stock options at $1.53 to $5.76 a share.
They were sellers at $160 to $172 a share.
Most recently - March 25 - president J. Donald Sherman was a buyer using stock options at $5.76 a share. He sold the same day at $163.67. He made a profit for the day of about $4 million.
Charts
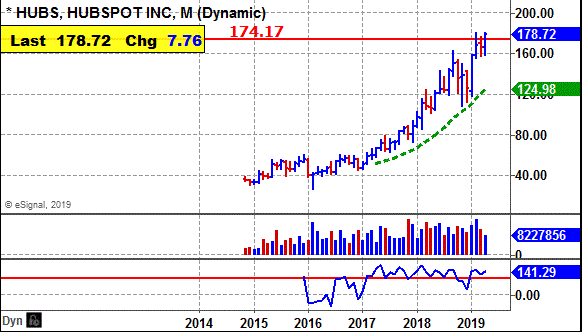
HUBS's long-term chart shows the stock coming public in late 2014 at $36. The stock rallied to $60 by late 2015 and then went into a long-term base.
It broke out in early 2017 and since then has been trending aggressively higher. It is in good position to breakout to a new all-time high.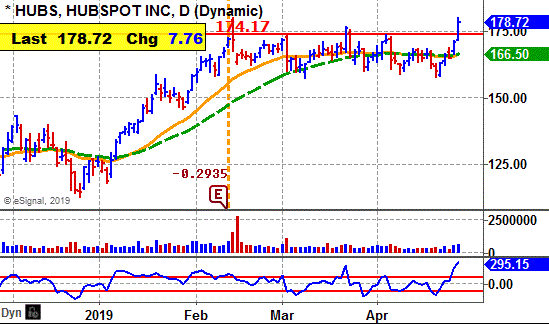
HUBS daily chart shows the stock climbing from $112 back in late 2018 to a peak near $174 by February.
The stock put down a tight flat base and breaks out Friday.
The move comes with a good widening of the daily spread. That is a sign the buying is able to push the price higher.
HUBS's CCI momentum indicator (bottom of chart) is strongly bullish.
Earnings Outlook
This year, analysts are forecasting a 29% jump in net to $1.15 a share from the 89 cents the year before.
The stock sells with a price-earnings ratio of 147. That is very high. The stock is most suitable for aggressive bulls.
Looking out to 2020, profits are projected to climb 46% to $1.68 a share from the anticipated $1.15 this year.
Net for the upcoming first quarter should jump 67% to 25 cents a share from the 15 cents the year before.
The highest estimate on the Street from 12 analysts is at 27 cents a share.
The company reports May 7.
HUBS topped the consensus quarterly estimate the past four quarters by 7 cents a share, 12 cents, 2 cents and 4 cents.
Strategy Opinion: TTD is targeting HUBS for a move to $210.
A protective stop can be placed near $168.
Intermediate-Term Rating: Average.
Suitability: Very Aggressive Bulls.
TTD's special research of Stock's Prior Performance:
Probability - Breakout Success - Bullish - HUBS scored some solid but modest gains off some of its recent breakouts.
Probability - Earnings Response - Bullish - HUBS rose 7 times after the past 8 earnings reports when there was a significant change in price.
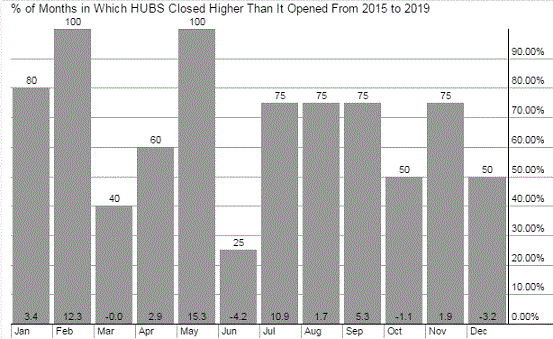
Probability: Seasonal Success - Very Bullish - HUBS averaged a gain of 15.3% in May and a decline of 4.2% in May the past several years.
Stock's Prior Performance After A Breakout
|
Stock's % Change from Breakout to peak - prior to cut below 50-day M/A. |
Date of Breakout |
Break point Price |
Stocks Price Peak after Breakout - prior to cut below 50-day M/A |
Date Trade Closed |
|
20% |
1/17/2019 |
146.27 |
176.22 |
3/21/2019 |
|
10% |
9/6/2018 |
145.29 |
159.60 |
9/13/2018 |
|
18% |
5/31/2018 |
120.10 |
142.10 |
6/20/2018 |
|
14% |
12/15/2017 |
87.57 |
100.90 |
1/22/2018 |
|
18% |
5/1/2017 |
66.23 |
78 |
6/8/2017 |
(In actual trading, entry and exit points could vary depending on broker execution.
Also, ideal are breakouts to a new 52-week high or better, perhaps all-time highs.)
Stock's Long-term Chart
Stock's Performance Chart with Quarterly Earnings Markers vs. S&P 500
Insider Buying in Green - Insider Selling in Red
Stock's Monthly Seasonal Performance Chart - Past 5 Years
Showing % Months UP and % Change
| TTD's Breakout Profile Rating Hubspot Inc. (HUBS) |
| TTD Check List | Bullish | Bearish | Neutral |
| Near 52-week High | YES | ||
| Volume | YES | ||
| Tick Volume | YES | ||
| Price Trend - Daily | YES | ||
| Price Trend - Long Term | YES | ||
| Price Daily Spread | YES | ||
| Base Structure | YES | ||
| Base - A-D | YES | ||
| Earnings-Quarterly | YES | ||
| Earnings-Long Term | YES | ||
| Earnings Outlook | YES | ||
| Industry Group | YES | ||
| Prior Breakout Success | YES | ||
| Fund Sponsorship | YES | ||
| Total Score | 14 | 0 | 0 |
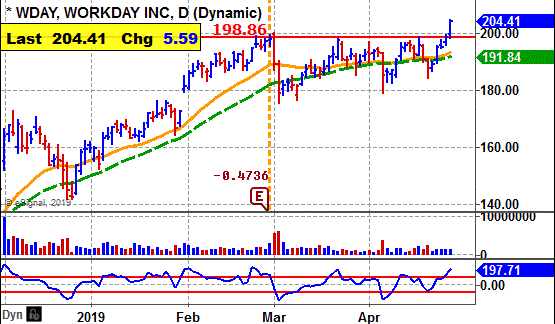
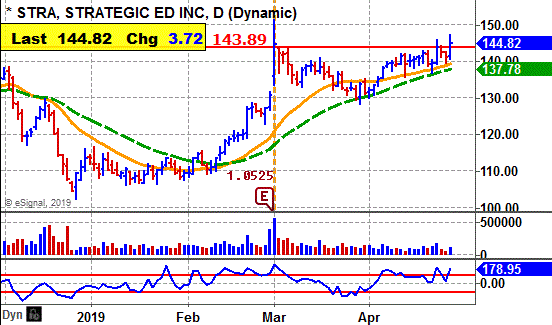
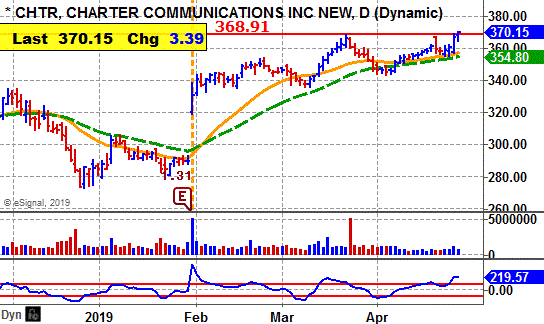
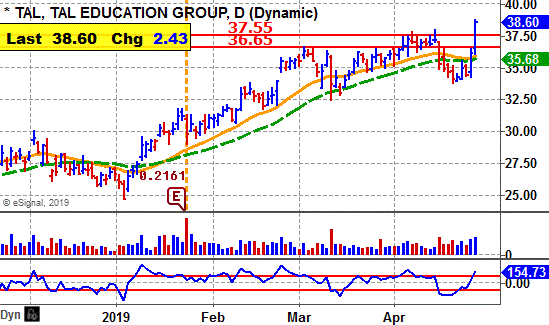
Charts of Selected Breakout Stocks
|
TTD's Quality Rating of Stock - WDAY - AVERAGE |
|
TTD's Quality Rating of Stock -STRA - AVERAGE |
|
TTD's Quality Rating of Stock - CHTR - AVERAGE |
|
TTD's Quality Rating of Stock - TAL - AVERAGE |

Ticker Tape Digest’s Daily List of “Stocks To Sell or Sell Short” ranks stocks well timed to be sold immediately based on daily trading. The list can be used as an alert to reduce current long-term positions.
Shorts from tape action so far today - 2
Stocks Screened - 12,234
Long-Term Environment for bears: Unfavorable.
Bear Side - Small list of breakdown stocks Friday. Bears be conservative.
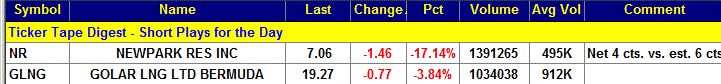
NR, based in the Woodlands, Tex., supplies fluid systems to the oil and gas exploration and production industry. Annual revenues: $947 million. NR's stock falls sharply Friday and undercuts key technical support. 
So far today, NR is trading a heavy 1.4 million shares, almost triple its average daily volume of 495,000 shares.
TTD sees more on the downside.
NR reported earnings for the first quarter of 4 cents a share. That was below the Street estimate of 6 cents a share.
The stock gapped lower in the morning and undercut key technical support. The stock continued lower the rest of the day and finished near its low for the session. 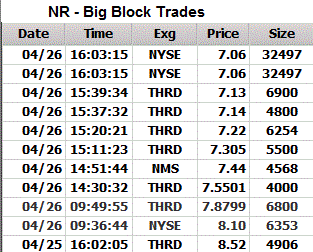
That is bearish.
Tape Action
NR's tape action shows the recent block trades.
One can see the price for the blocks falling from $8.52 in the prior session down to $7.06 near the close Friday.
A key bearish trade came in the morning when a block of 6,353 shares crossed the tape at $8.10.
That was down from the prior block at $8.52 on 4,906 shares late on Thursday.
Then near the close a massive block of 32,497 shares (duplicated) crossed the tape at $7.06.
That was down from the prior block at $7.13 on 6,900 shares.
Business
The company's segments include Fluids Systems, and Mats and Integrated Services. The fluids systems provides drilling fluids to customers in North America; Europe, the Middle East and Africa, Latin America, and Asia Pacific.
The mats and integrated services unit provides composite mat rentals, as well as location construction and related site services, to customers at well, production, transportation and refinery locations in the U.S.
Earnings:
This year, analysts are forecasting a 7% decline in net to 38 cents a share from the 41 cents the year before.
That forecast could come down. Currently, 4 analysts follow the stock.
Net for the second quarter is expected to decline 25% to 9 cents a share from the 12 cents the year before.
Charts:
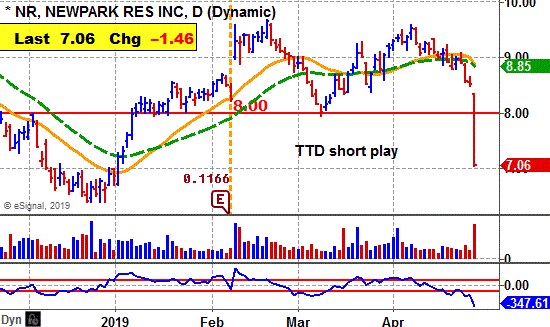
NR's daily chart shows the stock gapping sharply lower with big volume.
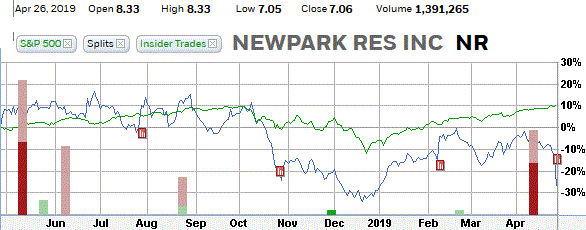
NR's 12-month performance chart shows the stock down 25% versus a 10% gain for the stock market.
Strategy Opinion: TTD is targeting NR for a decline to $5 within the next few months, or sooner. A protective stop buy can be placed near $7.70.
Suitability: Aggressive Bears.
TTD's probability research of Prior Performance:
Probability - Earnings Response - Neutral - NR rose 5 times after the past 10 earnings reports when there was a significant change in price.
Probability: Seasonal Activity - Neutral. - NR averaged a decline of 4.7% in May but a gain of 5.3 in June the past several years.
|
TTD's Quality Rating of Stock - NR - BELOW AVERAGE |
Stock's Performance Chart with Quarterly Earnings Markers vs. S&P 500
Insider Buying in Green - Insider Selling in Red
TTD columnist Leo Fasciocco has covered the stock market for over 30 years. His articles appear in many publications. He has also been a speaker at the Money Show conferences. He has been on television and radio. He is author of many educational articles about stock investing and the book “Guide To High-Performance Investing.”

For information to subscribe to the Ticker Tape Digest Services call: Beverly Owen at 1-480-878-8381 or 480-704-3331
Distributed by Corona Publishing Enterprises. TickerTape Digest Inc. 1220 W. Sherri, Gilbert, Az. 85233.
TTD “Professional Report” is available on the Web: $100 per month. Password needed. Published daily - around 20 times a month.
TTD Pro Report includes a Morning chart slide show of breakout stocks, a Midsession video-audio show with commentary on breakout stocks and shorts and a Final end of day overall report on breakout stocks for the session, short plays and accumulation plays. There are other features too such as Quick Trades and Long-term Plays.
TTD Daily Report is $39. It covers a Morning slide show of charts of stocks breaking out and a TTD end of day print report covering breakout stocks and shorts.
Credit cards accepted. Payable to Corona Publishing Enterprises.
(The information contained has been prepared from data deemed reliable but there is no guarantee of complete accuracy. Ticker Tape Digest Inc. is not affiliated with any broker, dealer or investment advisor. Nothing in this publication constitutes an offer, recommendation or solicitation to buy or sell any securities. Further research is advised. This report is copyrighted and no redistribution is permitted with out permission.)