Daily - Go to TTD's Tape of Breakout and Leading Stock Charts - Friday, April 27
|
Daily - Go to TTD's Tape of Breakout and Leading Stock Charts - Friday, April 27 |
|
Weekly - Bullish Conservative Investors - Go To TTD Long-Term Plays - Monday, April 23 |
|
Go to TTD Stock Market Shows for Latest Week: Monday - Key Featue stock - Brinker International Inc. (EAT) - 9 minutes) Tuesday- Key Feature Stock - Carlisle Cos. (CSL) - (13 -minutes) Wednesday- Key Feature stock - Ultimate Software Inc. (ULTI) - (14 minutes) Thursday- Key Feature Stock - Citrix Systems Inc. (CTXS) - ( 12 minutes) Friday - Abaxis Inc. (ABAX) - ( 13 Minutes) Go to Video Show - "How to Make Money With Breakout Stocks" |
|---|

By Leo Fasciocco -- TTD
Ticker Tape Digest presents its daily stock market report containing stocks to go long as breakout trades, quick trades, or bargain trades. We also feature stocks under  Significant Accumulation that are poised to breakout.
|
Ticker Tape Digest's Daily schedule guide for TTD subscribers 1. Pre-market - check Breakout Watch List and Quick Trades. 2. Morning - (11:30 - 12 A.M.) - check breakout stocks tape and breakout chart slide show. 3. Midday (1 P.M.) check TTD Midsession Report and see market video show. 4. After close (4 P.M.) check final TTD Report for day. Trading Strategies Bullish Aggressive Investors Bullish - "Breakout Stocks" - ideally suited for bull markets and special situation stocks. Potential for large returns. (See Performance) Aggressive Investor Bullish- "Quick Trade Stocks" -ideally suited for entry into top performing issues looking for a small quick profit." (See Performance) Conservative Investors "Bargain Buy Trades for the Long Term." Ideally suited for entry into top performing big cap stocks on pullbacks within overall up trend.(See Performance) Bearish Aggressive Bearish Investors - "Breakdown Stocks" to Sell Short. Ideally suited for bear markets or market pull backs. Potential for large returns (See Performance) |
|---|
The TTD report also contains stocks to short as breakdown plays and as bargain (swing trade) shorts.
Investors should tend to try to go with a strategy that fits with the stock market's trend, unless there is a special situation play.
TTD's Breakout Stocks - Long are most suitable for aggressive investors seeking ideal entry points into leading stocks, especially during bull markets. They can do extremely well in bull markets with gains of as much as several hundred percent.
These stocks can also do extremely well during strong market rallies, or if they are in a industry group that is performing very well. They tend to have strong earnings outlooks and are near new-52 week, or all-time highs.
TTD Quick Trade Stocks - Long These are leading issues that have pulled back in recent days, but could move higher soon. They are most suitable for Aggressive Investors willing to trade short term. These stocks will do extremely well during market advances. They have about 74% win rate. During market rally sequences the win rate is even higher. The return is small 3% to 8% in just a few days.
TTD's Bargain Buy Trades - Long - Long Term. These are for conservative bullish Investors These long-term buys are ideally suited for entry into stocks on pull backs within overall up trend. These stocks can give a good return long-term especially during a bull market.
TTD also presents Stocks To Sell or Sell Short. These issues are suitable for aggressive investors willing to take short positions both as trades or for longer-term plays. These stocks will do very well during bear markets or market pull backs.
TTD's Bearish breakdown stocks to sell short. These issues have potential to fall sharply. They often show a technical breakdown and also some fundamental business problem such as weak earnings.
TTD's multi-media updates include a slide-show that presents charts and analysis at midsession. Some times TTD presents feature analysis on stocks and the market. TTD uses Windows Media Files. (WMV).
TTD also presents a "Breakout Watch List" that is up dated daily. This list consists of key stocks in position to breakout. A close watch of this list can put you in the stock just as it breaks out. A good idea is to study the list and be ready to move into a stock quickly as it hits its breakpoint.
TTD often suggests using stop buy orders to enter. It is very important to buy a breakout stock as close as possible to the breakpoint. The idea is to get "elbow room" if the stock should follow through to the upside. This is very important in being successful in making big money with breakout stocks.
It is also essential to have a stop loss strategy for all stocks in which positions are taken. Not every stock will work as expected. It is important for investors to "police" their portfolios and avoid getting trapped in any bad positions.
Quality rating of breakout Two key factors: 1 - Stock near all-time in price or near a 52-week high. 2 - earnings growth current year is strong. The ideal play is a stock with an Above Average Quality Rating. The stock is near a new high and will have strong earnings. TTD's other ratings are Average and Below Average.
TTD also has special feature sections on Educational Tips on Investing.
To email Mr. Leo Fasciocco leo@tickertapedigest.com.For service, email Beverly Owen owen@tickertapedigest.com. TTD’s Tel: 1-480-926-1680.

Ticker Tape Digest's Midsession Stock Market Video Show(Posted 12:30 to 1 p.m. NYSE Time) Go to TTD Stock Market Show For - April 27Go to Shows for Latest Week: Monday
-
Tuesday
-
Wednesday
-
Thursday
-
Friday
|
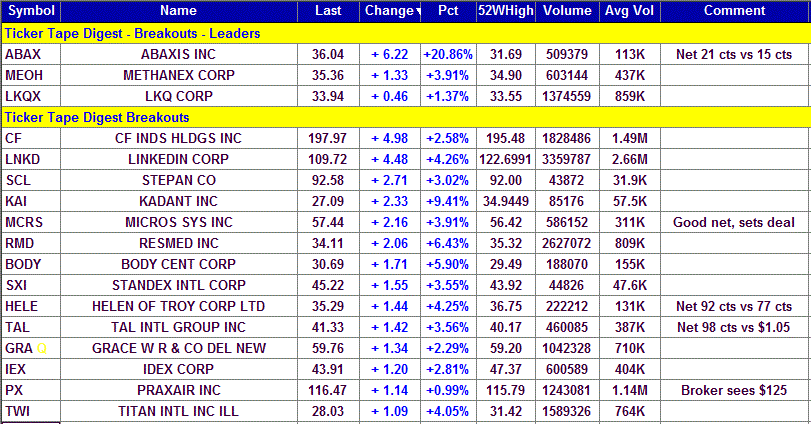
Breakout Stocks
Total Buy Breakouts so far today - 38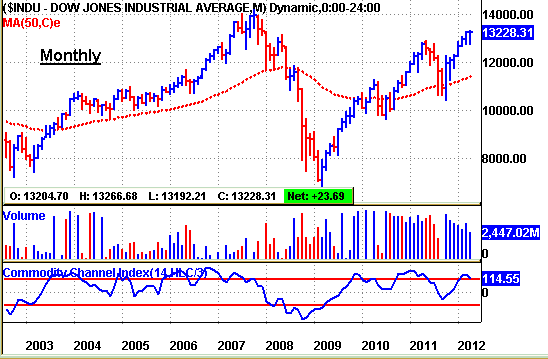
Overall Quality of Breakouts - Average
Stocks Screened - 8,300
Bull side - Massive number of breakouts today. The lagging housing stocks are breaking out. Bulls be venturesome. Stock market holds in up trend with momentum still bullish. (Put mouse on Dow chart to see Nasdaq chart)
Long Term Environment for bulls: Favorable
Stock Market Momentum:
Market (Daily) - NYSE Bullish, Nasdaq Bullish
Market (Weekly) - NYSE Bearish, Nasdaq Bearish
Market (Monthly) - NYSE Bullish, Nasdaq Bullish
Ticker Tape Digest's
|
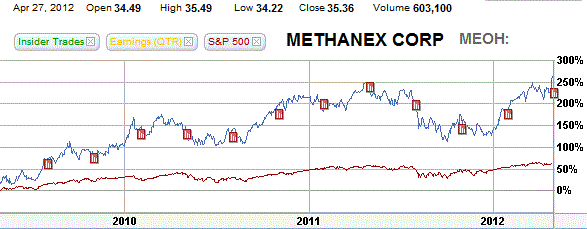
TTD's Quality Rating of Stock - MEOH - ABOVE AVERAGE |
MEOH, based in Vancouver, Canada., produces Methanol made from natural gas. Annual revenues: $2.7 billion. MEOH's stock breaks out today from a seven-week flat base. The stock had a strong move higher on Thursday. Today's push clears the base nicely. MEOH is poised to show strong profits for this year. So far today, MEOH is trading 603,144 shares. Its average daily volume is 437,000 shares. 
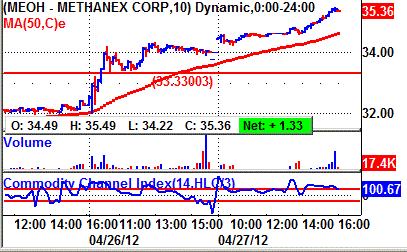
TTD highlighted MEOH as a breakout on Friday at our midsession video show on the web.
MEOH's 10-minute chart shows the stock working steadily higher the past two sessions.
At the bell Friday, MEOH closed at $35.36, up $1.33. That was near its high for the day of $35.49. A close near the high on a breakout is often very bullish. So, the stock has strong upside momentum.
TTD's clip of the tape shows the recent big block trades. 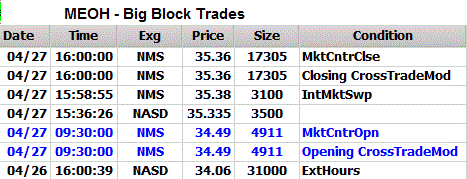
One can see the price for the blocks moving higher from $34.06 to a peak of $35.38 on Friday. A key bullish trade came in the morning when a block of 4,911 shares (duplicated) crossed the tape at $34.09. That was up from the prior block trade at $34.06.
The tape showed good institutional buying in the morning.
MEOH makes methanol from natural gas. It is a basic chemical building block used to make formaldehyde, MTBE, acetic acid and other products.
The company operates production facilities in Canada, the United States, New Zealand and Chile. MEOH also markets additional methanol from plants in Trinidad and Europe.
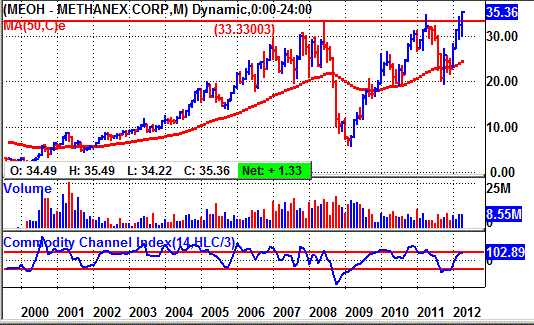
MEOH's 3-year performance chart shows the stock appreciating a sensational 260%. That compares with a 65% for the stock market.
MEOH's long-term chart going back 10 years shows the stock climbing from 3 to a peak of 33.20 by 2008. The stock was dragged lower during the bear market falling to 6. However, it has since rallied strongly and is now making new highs. It has made a sixfold move from its bear market low. 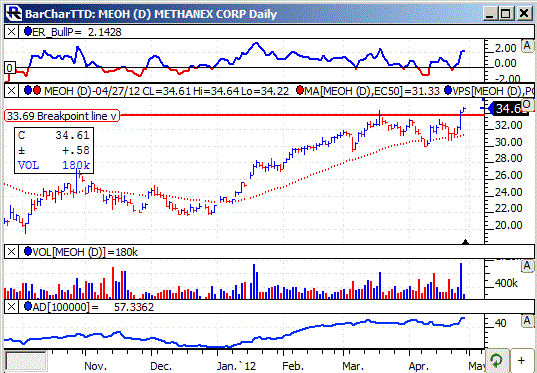
MEOH's daily chart shows the stock rising from 22 back in December to a peak of 33 in March. The stock then put down a well-formed flat base.
The stock poked its nose out of the base on Thursday. Today, it clears it nicely. Thursday's move came with a big jump in volume to 1.1 million shares, almost triple normal.
The stock's TTD momentum indicator (top of chart) is solidly bullish.
The accumulation - distribution line (bottom of chart) is in a solid up trend and compliments the price of the stock.
This year, analysts are forecasting MEOH's earnings will soar 44% to $2.96 a share from $2.06 a year ago. The stock sells with a price-earnings ratio of just 11.
Going out to 2013, net is projected to climb 20% to $3.57 a share from the anticipated $2.96 this year.
The company is benefiting from increased production and sales. It recently set a deal to buy methanol in Texas.
Net for the upcoming second quarter should leap 66% to 71 cents a share from 43 cents a year ago. The highest estimate on the Street is at 97 cents a share. So, some analysts see potential for a bigger quarter than the consensus. Looking ahead to the third quarter, profits are expected to jump 54% to 91 cents a share from 59 cents the year before. . 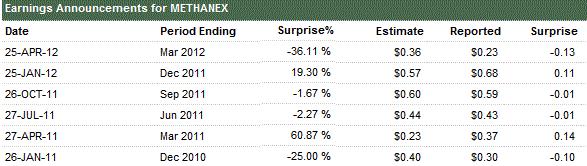
Strategy Opinion: TTD is targeting MEOH for a move to 43 off this breakout. A protective stop can be placed near 31.50. TTD rates MEOH an excellent intermediate-term play provided earnings remain on course. Also, the company recently boosted its dividend rate.
Sponsorship: Excellent. The larges fund holder is Allianz NFJ Small Cap Value Fund with a 2.3% stake. The 5-star rated fund has held its position steady. A key fund buyer was 4-star rated Fidelity Canada Fund, which added 100,000 shares.
Insider Activity: Not available. Seven analysts follow the stock, 4 have a buy, up from 3 three months ago.
Stock Performance Chart with Quarterly Earnings Markers
Insider Activity - Buying in Green - Selling in Red
| TTD's Breakout Profile
Rating Methanex Corp. - (MEOH) |
| TTD Check List | Bullish | Bearish | Neutral |
| Near 52-week High | YES | ||
| Volume | YES | ||
| Tick Volume | YES | ||
| Price Trend - Daily | YES | ||
| Price Trend - Long Term | YES | ||
| Price Daily Spread | YES | ||
| Base Structure | YES | ||
| Base - A-D | YES | ||
| Earnings-Quarterly | YES | ||
| Earnings-Long Term | YES | ||
| Earnings Outlook | YES | ||
| Industry Group | YES | ||
| Prior Breakout Success | YES | ||
| Fund Sponsorship | YES | ||
| Total Score | 14 | 0 | 0 |
Charts of Selected Breakout Stocks
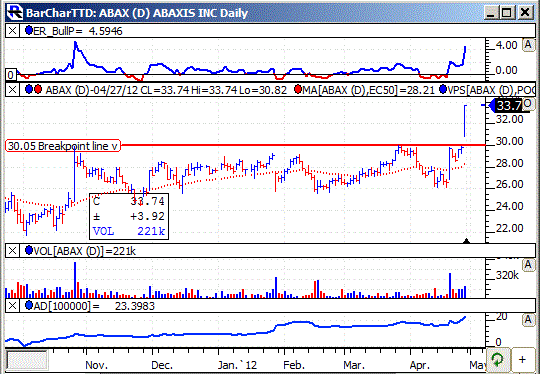
| TTD's Quality Rating of Stock - ABAX - ABOVE AVERAGE |
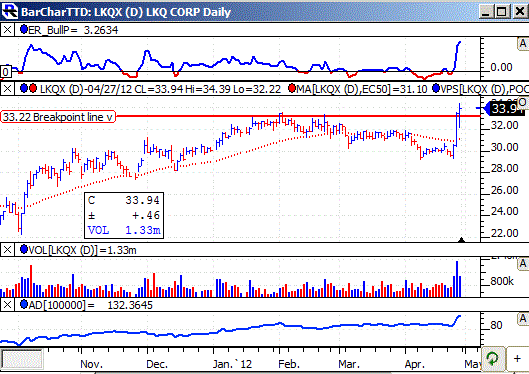
| TTD's Quality Rating of Stock - LKQX - ABOVE AVERAGE |
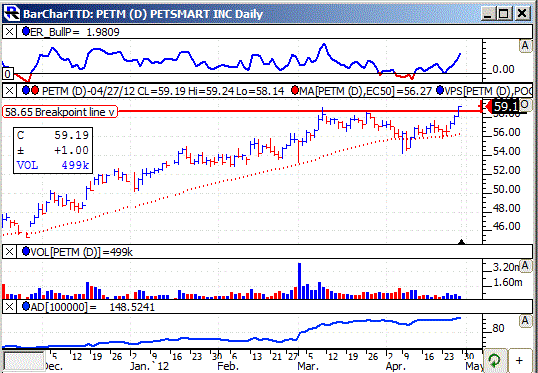
| TTD's Quality Rating of Stock - PETM - AVERAGE |
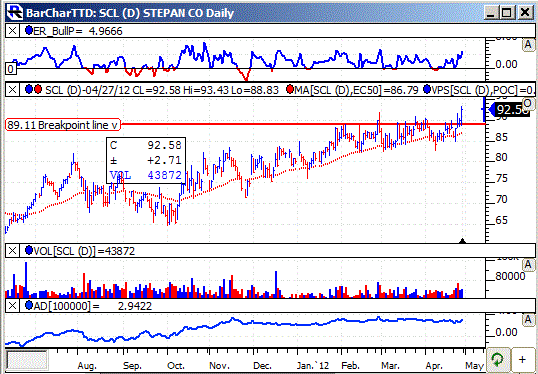
| TTD's Quality Rating of Stock - SCL - AVERAGE |
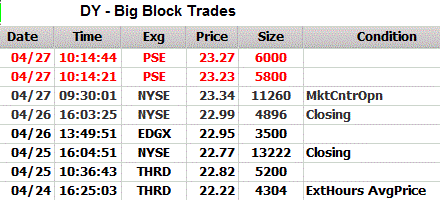
| TTD's Quality Rating of Stock - DY - AVERAGE |
DY, based in Palm Beach Gardens, Fla., provides special contracting services in the U.S. Annual revenues $1.1 billion. DY's stock is in a 13-week flat base. It is poised to breakout to a 4-year high. The stock is bumping up against its breakpoint today and could breakout at any time. With strong profits coming for the fiscal third quarter ending April 30, TTD sees DY in a good spot to be accumulated. 
TTD highlighted DY in our list of potential breakout stocks.
Today, DY's stock pushed higher in the morning. It peaked at $23.93 in the early afternoon. It then trended sideways "parked" just below its breakpoint.
TTD's clip of the tape shows the recent big block trades.
One can see the price for the blocks advancing from $22.22 to a peak of $23.34. A key bullish trade came in the morning when a block of 11,260 shares crossed the tape at $23.34. That was up from the prior block at $22.99. The tape showed good institutional buying interest.
DY's contracting services include engineering, construction, maintenance and installation services to telecommunications providers.
The company also doses underground locating services to various utilities including telecommunications providers and other services to electric utilities and others
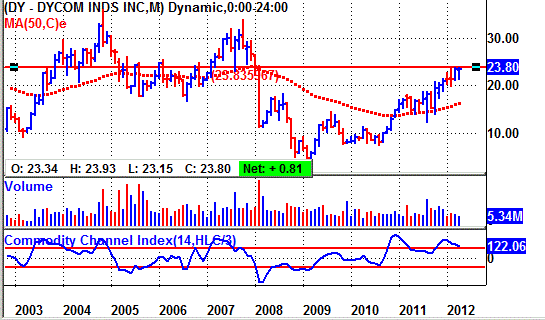
DY's long-term chart shows the stock climbing from 10 back in early 2003 to a peak of 36 in late 2004. The stock then trended sideways. In the subsequent bear market of 2008, the stock fell to 5 by early 2009. It has since been working higher nicely having made a fourfold move.
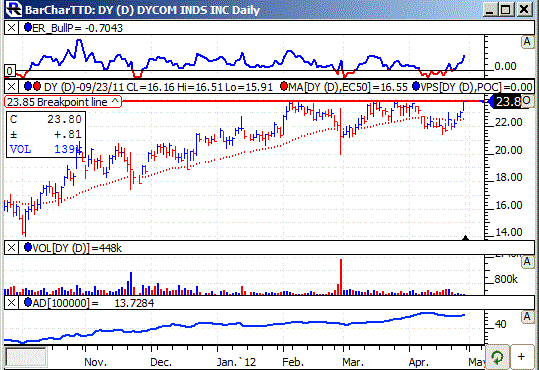
DY's daily chart show the stock advancing from 14 in October to near 24 by early February. The stock then trended sideways in a tight base bracketed between roughly 21 and 24.
The stock has now rallied to the top of the base and could breakout at any time. The TTD momentum indicator (top of chart) is solidly bullish.
The accumulation - distribution line (bottom of chart) is in a solid up trend indicating good underlying buying. The AD line compliments the price advance of the stock the past few months.
Analysts are looking for DY to rack up a 107% increase in net for the fiscal third quarter ending April 30 to 21 cents a share from 10 cents a year ago.
The highest estimated on the Street is at 22 cents a share. TTD sees excellent chats for an upside surprise. The past four quarters, DY topped the consensus estimate by 5 cents a share, 8 cents, 14 cents and 5 cents. That is very impressive and consistent.
Net for the fiscal year ending July 30 should surge 79% to $1.09 a share from 61 cents a year ago. The stock sells with a price-earnings ratio of 21. TTD sees that as low making the stock a good value-growth play.
Going out to fiscal 2013 ending in July, profits are projected by the Street to climb 25% to $1.37 a share from the anticipated $1.09 this fiscal year.
Strategy Opinion: TTD suggests accumulation of a partial stake in DY with further buying to be done on a move over $23.95. TTD is targeting DY for a move to 30 after a breakout. TTD rates DY a good intermediate-term play.
Sponsorship: Average. A key buyer of the stock recently was 3-star rated Principal SmallCap Growth Fund which purchased 46,042 shares. DY has 33.5 million shares outstanding. Institutions hold 83% of the stock.
Insider Trading: Bullish. Insiders have been buyers of the stock using stock options and also via market purchases. They have done some modest selling. Six analysts follow the stock, 4 have a buy, the same as three months ago.
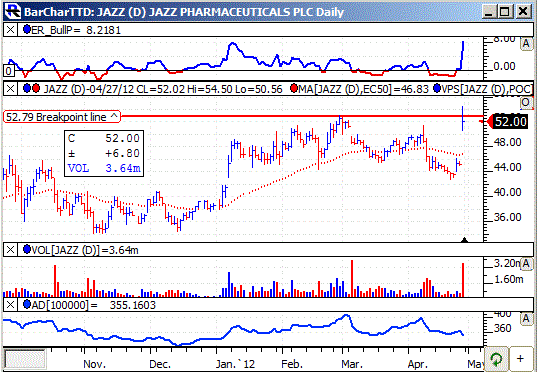
| TTD's Quality Rating of Stock - JAZZ - ABOVE AVERAGE |
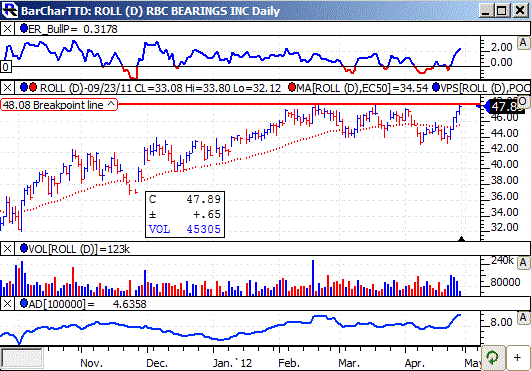
| TTD's Quality Rating of Stock - ROLL - ABOVE AVERAGE |
 Ticker Tape Digest’s
 Ticker Tape Digest’s Daily List of “Stocks To Sell or Sell Short” ranks stocks well timed to be sold immediately based on daily trading. The list can be used as an alert to reduce current long-term positions.
Shorts from tape action so far today - 5
Stocks Screened - 8,300
Long-Term Environment for bears: Unfavorable.
Bear Side - Small number of breakdown issues as stock market works higher across its current trading range. Bears be selective.
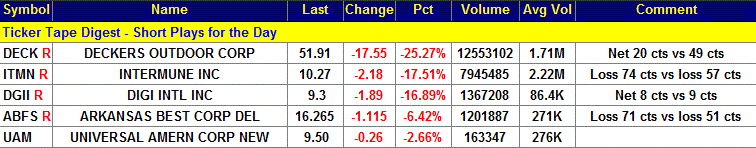
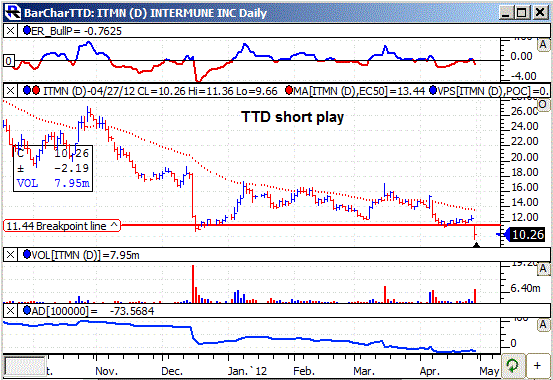
ITMN, based in Brisbane, Ca., is a biotech firm doing research to develop products to treat serious pulmonary and infectious diseases and congenital disorders. Annual revenues: $26 million. ITMN's stock falls sharply today after the company reported a larger loss for the first quarter than from a year ago. So far today, ITMN is trading 8.4 million shares, four times its normal daily volume of 2.2 million shares. 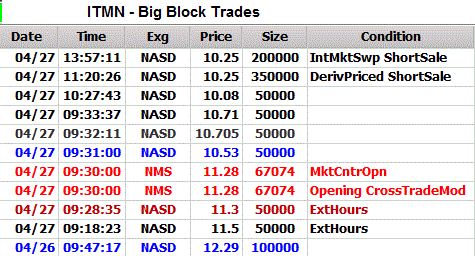
ITMN reported a first quarter loss 74 cents a share, greater than the loss of 57 cents a share a year ago. The Street was expecting a loss of 71 cents a share.
The stock took a dive in the morning and made an intraday low of 9.66. The stock then staged a modest rally to 10.68, faded back a bit and trended sideways the rest of the day.
TTD's clip of the tape shows ITMN's big block trades. One can see the price for the blocks declining from $12.29 to $10.08 in the morning. A key bearish trade came in the early morning when a block of 50,000 shares crossed at $11.50, down from the prior block trade at $12.29.
ITMN markets ACTIMMUNE for chronic granulomatous disease and osteopetrosis. The company has active development programs underway for other disease areas.
This year, analysts are forecasting ITMN will show a loss of $2.95 a share compared with a loss of $2.58 a year ago. For the upcoming second quarter, a loss of 74 cents a share is anticipated.
ITMN's daily chart shows the stock declining from 26 in November to 11 in December. The stock did lift a bit in price, but its accumulation - distribution line continued to move lower indicating clear selling pressure.
Strategy Opinion: TTD is targeting ITMN for a decline to 7.50 within the next few months or sooner. A protective stop buy can be placed near 10.80.
| TTD's Quality Rating of Stock - ITMN - BELOW AVERAGE |
TTD columnist Leo Fasciocco has covered the stock market for over 20 years. His articles appear in many publications. He is also a speaker at the Intershow conferences. He has been on television and radio. He is author of many educational articles about stock investing and the book “Guide To High-Performance Investing.”

For information to subscribe to the Ticker Tape Digest Services call: B. J. Owen at 1-480-926-1680. Distributed by Corona Publishing Enterprises. Ticker Tape Digest Inc. P.O. Box 2044 Chandler, Az. 85244-2044. TTD “Professional Report” is available on the World Wide Web: $100 per month. Password needed. “TTD Professional“ Faxed is $200 per month. The TTD Daily Report is $39.95. Credit cards accepted.
(The information contained has been prepared from data deemed reliable but there is no guarantee of complete accuracy. Ticker Tape Digest Inc. is not affiliated with any broker, dealer or investment advisor. Nothing in this publication constitutes an offer, recommendation or solicitation to buy or sell any securities. Further research is advised. This report is copyrighted and no redistribution is permitted with out permission.)
