![]()
|
|
|
|
|
Go to Video Show - "How to Make Money With Breakout Stocks |
|---|

By Leo Fasciocco -- TTD
Ticker Tape Digest presents its daily stock market report containing stocks to go long as Breakout Trades, Quick Trades, or Bargain Accumulation Trades.
We also feature stocks under Significant Accumulation that are poised to breakout.
|
Ticker Tape Digest's Daily schedule guide for TTD subscribers 1. Pre-market - check Breakout Watch List and Quick Trades. 2. Morning - (11:30 - 12 A.M.) - check breakout stocks tape and breakout chart slide show. 3. Midday (1 P.M.) check TTD Midsession Report and see market video show. 4. After close (4 P.M.) check final TTD Report for day. Trading Strategies Bullish Aggressive Investors Bullish - "Breakout Stocks" - ideally suited for bull markets and special situation stocks. Potential for large returns. (See Performance) Aggressive Investor Bullish- "Quick Trade Stocks" -ideally suited for entry into top performing issues looking for a small quick profit." (See Performance) Conservative Investors "Bargain Buy Trades for the Long Term." Ideally suited for entry into top performing big cap stocks on pullbacks within overall up trend.(See Performance) Bearish Aggressive Bearish Investors - "Breakdown Stocks" to Sell Short. Ideally suited for bear markets or market pull backs. Potential for large returns (See Performance) |
|---|
The TTD report also contains stocks to short as breakdown plays and as bargain (swing trade) shorts.
Investors should tend to try to go with a strategy that fits with the stock market's trend, unless there is a special situation play.
TTD's Breakout Stocks - Long are
most suitable for aggressive investors seeking ideal entry points into leading stocks, especially during bull markets. They can do extremely well in bull markets with gains of as much as several hundred percent. 
These stocks can also do extremely well during strong market rallies, or if they are in a industry group that is performing very well. They tend to have strong earnings outlooks and are near new-52 week, or all-time highs.
TTD Quick Trade Stocks - Long These are leading issues that have pulled back in recent days, but could move higher soon. They are most suitable for Aggressive Investors willing to trade short term. These stocks will do extremely well during market advances. They have about 74% win rate. During market rally sequences the win rate is even higher. The return is small 3% to 8% in just a few days.
TTD's Bargain Buy Trades - Long - Long Term. These are for conservative bullish Investors These long-term buys are ideally suited for entry into stocks on pull backs within overall up trend. These stocks can give a good return long-term especially during a bull market.
TTD also presents Stocks To Sell or Sell Short. These issues are suitable for aggressive investors willing to take short positions both as trades or for longer-term plays. These stocks will do very well during bear markets or market pull backs.
TTD's Bearish breakdown stocks to sell short. These issues have potential to fall sharply. They often show a technical breakdown and also some fundamental business problem such as weak earnings.
TTD's multi-media updates include a slide-show that presents charts and analysis at midsession. Some times TTD presents feature analysis on stocks and the market. TTD uses Windows Media Files. (WMV).
TTD also presents a "Breakout Watch List" that is up dated daily. This list consists of key stocks in position to breakout. A close watch of this list can put you in the stock just as it breaks out. A good idea is to study the list and be ready to move into a stock quickly as it hits its breakpoint.
TTD often suggests using stop buy orders to enter. It is very important to buy a breakout stock as close as possible to the breakpoint. The idea is to get "elbow room" if the stock should follow through to the upside. This is very important in being successful in making big money with breakout stocks.
It is also essential to have a stop loss strategy for all stocks in which positions are taken. Not every stock will work as expected. It is important for investors to "police" their portfolios and avoid getting trapped in any bad positions.
Quality rating of breakout Two key factors: 1 - Stock near all-time high in price or near a 52-week high. 2 - earnings growth current year is strong. The ideal play is a stock with an Above Average Quality Rating. The stock is near a new high and will have strong earnings. TTD's other ratings are Average and Below Average.
TTD also has special feature sections on Educational Tips on Investing.
To email Mr. Leo Fasciocco leo@tickertapedigest.com.
For service, email Beverly Owen owen@tickertapedigest.com. TTD’s Tel: 1-480-878-8381 or 480-704-3331.
Tuesday - April 28, 2020
TTD's Breakout Stocks
Stock Market Overview
Total Buy Breakouts - 3
Quality of Breakouts - Average.
Stocks Screened - 12,234
Bull side - Small list of breakouts and very selective. Bulls be conservative.
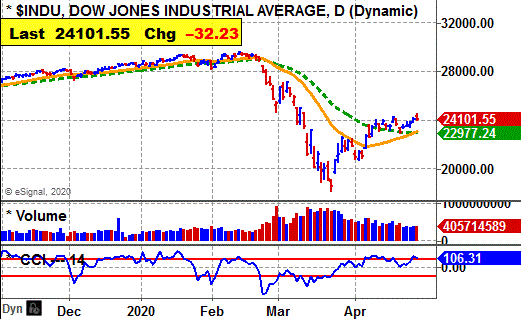
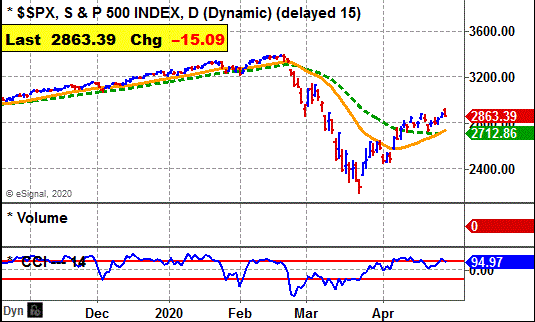
Stock market - Daily averages remain bullish. However, Dow and S&P still bearish weekly and monthly.
Comment - Stock market consolidating recent advance. The inflow of earnings will now have a big impact.
See Latest Earnings Reports - A company that tops the Street's highest earnings estimate has potential to go higher. Key earnings beats - HOG, DHI, MRC, ARAY, OI, MTH and ROK.
Stock Market Momentum
(Daily is based on a moving average)
|
Market (Daily) |
Market (Weekly) |
Market (Monthly) |
|
Dow - Bullish |
Dow - Bearish |
Dow - Bearish |
|
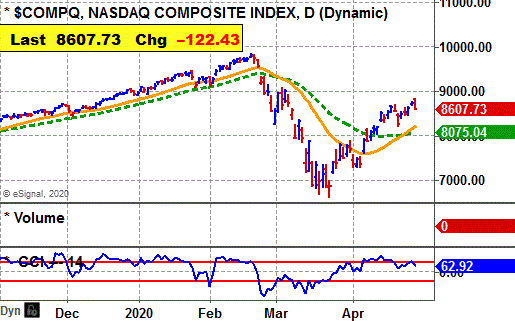
Nasdaq - Bullish |
Nasdaq - Bullish |
Nasdaq - Bullish |
|
S&P 500 - Bullish |
S&P 500 - Bearish |
S&P 500 - Bearish |
 Ticker Tape Digest's
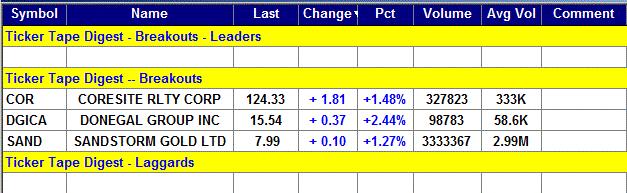
|
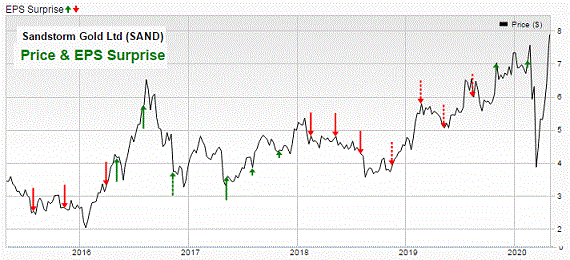
TTD's Quality Rating of Stock - SAND - ABOVE AVERAGE |
SAND, based in Vancouver, Canada, is a gold royalty company providing financing. Annual revenues: $89 million. SAND's stock edges higher and clears its breakpoint line Tuesday. 
The stock is part of the strong acting gold sector.
So far today, SAND is trading 3.3 million shares. Its average daily volume is 3 million shares. 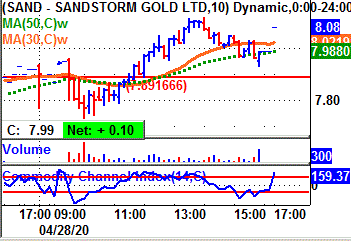
SAND's stock dipped in the early morning, but then turned up and cleared its breakpoint line.
The stock reached an intraday peak at $8.12 in the early afternoon.
The stock then backed off late in the day.
In after-hours trading, the stock rose 11 cents a share. That is a big plus.
Tape Action
SAND's tape action shows the recent block trades.
One can see the price for the blocks rising from $7.73 in the morning to as high as $8.08 by the afternoon. 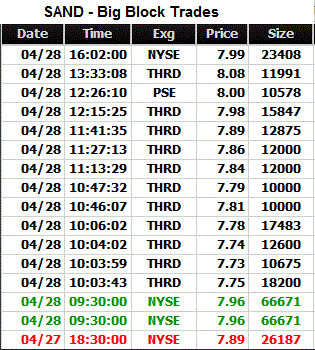
A key bullish trade came in the morning when a block of 66,671 shares (duplicated) crossed the tape at $7.96.
That was up from the prior block at $7.89 on 26,187 shares late on Monday.
Business
SAND provides financing to gold mining companies that are looking for capital and in return receives the right to a percentage of the gold produced from a mine, for the life of the mine.
The company has acquired a portfolio of 188 royalties, of which approximately 21 of the underlying mines are producing.
It is focused on investments towards production profile through the acquisition of additional gold royalties.
Charts
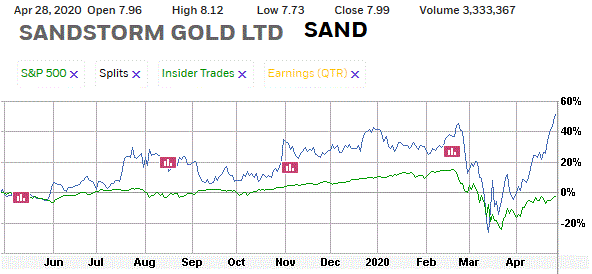
SAND's 12-month performance chart shows the stock up 50% versus a 3% decline for the stock market.
Insider activity was not available.
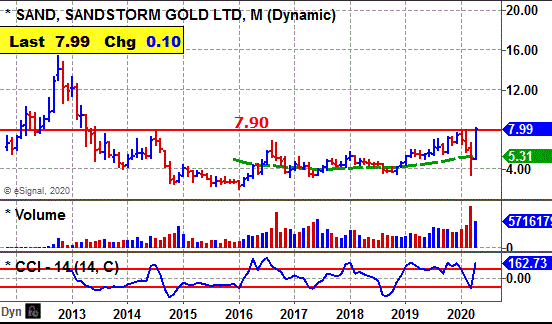
SAND's long-term chart shows the stock climbing to a peak near $15 back in 2012.
However, the stock fell back and then traded in a range between $8 and $2 for the next several years.
The breakout Tuesday carries the stock to a multi-year high. 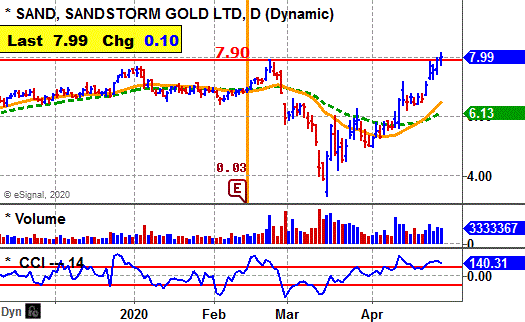
SAND's daily chart shows the stock in a cup-and-handle base.
That was set up after the stock rallied strongly from near $4 to almost $8 - a double.
The breakout just clears the base.
The stock's CCI momentum indicator is solidly bullish.
Earnings Outlook
This year, analysts are forecasting a 56% jump in net to 14 cents a share from 9 cents the prior year.
The stock sells with a price-earnings ratio of 57. That is reasonable.
Looking out to 2021, the Street predicts a 10% increase in net to 15 cents a share from the anticipated 14 cents this year.
Three analysts follow the stock.
Net for the first quarter should be up 200% to 3 cents a share from one cent the prior year.
Then in the second quarter profits should be up 300% to 4 cents a share from one cent the previous year.
Strategy Opinion: TTD is targeting SAND for a move to $11 within the next few months, or sooner.
A protective stop can be placed near $7
Intermediate-Term Rating: Average.
Suitability: Aggressive Bulls.
TTD's special research of Stock's Prior Performance:
|
Breakout Success |
Bullish |
SAND scored good gains off recent breakouts. |
|
Response to Net |
Bullish |
SAND rose 10 times after 15 earnings reports. |
|
Seasonal Success |
Bullish |
SAND avg. loss 4.8% in May, up 9.8% in June prior years. |
|
Earnings Beats |
Bearish |
SAND beat Street net estimate 4 times after 15 reports. |
Stock's Prior Performance After A Breakout
|
Stock's % Change from Breakout to peak - prior to cut below 50-day M/A. |
Date of Breakout |
Break point Price |
Stocks Price Peak after Breakout - prior to cut below 50-day M/A |
Date Trade Closed |
|
4% |
12/24/2019 | 7.15 | 7.45 | 1/2/2020 |
|
15% |
7/18/2019 | 5.88 | 6.76 | 8/5/2019 |
|
20% |
1/28/2019 | 4.85 | 5.80 | 2/22/2019 |
|
40% |
4/5/2016 | 3.14 | 4.39 | 5/17/2016 |
(In actual trading, entry and exit points could vary depending on broker execution.
Also, ideal are breakouts to a new 52-week high or better, perhaps all-time highs.)
Stock's Long-term Chart
Stock's Price Performance after Reporting Earnings
Stock's Performance Chart with Quarterly Earnings Markers vs. S&P 500
Insider Buying in Green - Insider Selling in Red
Charts of Selected Breakout Stocks
|
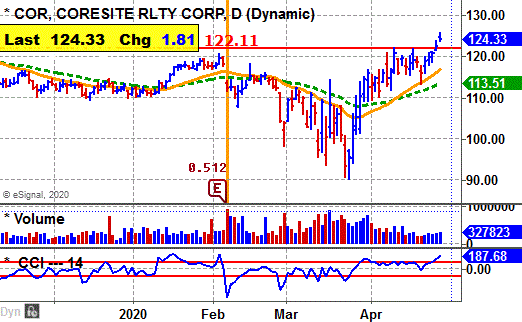
TTD's Quality Rating of Stock - COR - AVERAGE |
|
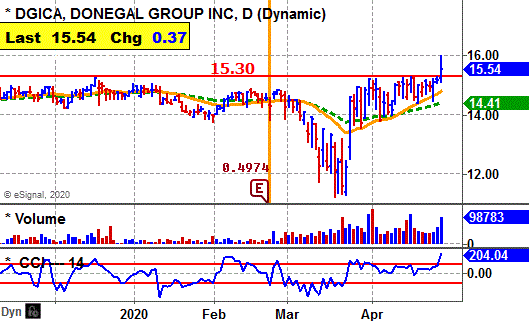
TTD's Quality Rating of Stock - DGICA - AVERAGE |

Ticker Tape Digest’s Daily List of “Stocks To Sell or Sell Short” ranks stocks well timed to be sold immediately based on daily trading. The list can be used as an alert to reduce current long-term positions.
Shorts from tape action - 1
Stocks Screened - 12,234
Long-Term Environment for bears: Unfavorable.
Bear Side - Small list of shorts. Bears be conservative. Earnings will be coming in now and one must be alert. Stock market is holding after recent rally off lows.
![]()
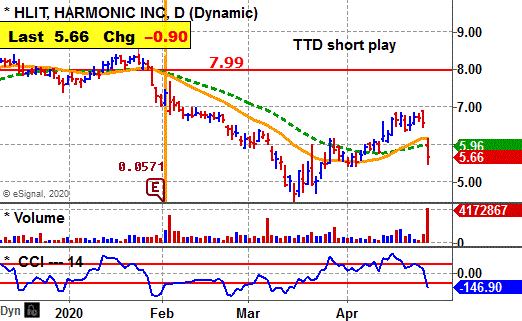
HLIT, based in San Jose, Ca., makes and designs video infrastructure products and systems. It has two segments: Video and Cable Edge. Annual revenues: $403 million. HLIT's stock falls sharply Tuesday after the company reported a loss for the quarter. 
So far today, HLIT is trading 4.2 million shares, five time its average daily volume of 791,000 shares.
TTD sees more on the downside.
HLIT reported a loss for the first quarter of 10 cents a share. That was more than the loss of 5 cents a share expected by the Street.
HLIT's stock gapped lower and broke below its trend line on big volume. 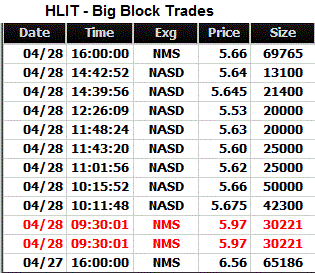
Tape Action
HLIT's tape action shows the recent block trades.
One can see the price for the blocks falling from $6.56 in the prior session to as low as $5.53 by midday.
A key bearish trade came in the morning when a block of 30,221 shares (duplicated) crossed the tape at $5.97.
That was down from the prior block at $6.56 on 65,186 shares late on Monday.
Business
HLIT sells video processing and production and playout solutions.
They sell to media companies, streaming media firms, cable operators, and satellite and telecom firms and pay television service providers.
Its Cable Edge business sells cable edge solutions to cable operators around the world.
Earnings:
This year, analysts are forecasting 47% drop in net to 16 cents a share from the 30 cents the prior year.
For the upcoming second quarter, analysts are projecting a profit of one cent a share compared with a loss of 4 cents the prior year.
Charts:
HLIT's daily chart shows the stock gapping lower with big volume. The technical pattern shows a resumption of the down trend.
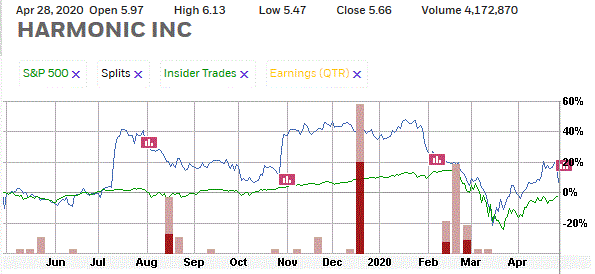
HLT's 12-month performance chart shows the stock up 4% versus a 2% drop in the stock market. Insiders were sellers this year at $6.75 to $7,92 a share.
Strategy Opinion: TTD is targeting HLIT for a decline to $4.40. A protective stop buy can be placed near $5.90.
Suitability: Aggressive Bears.
TTD's Stock Probability research of Prior Performance:
|
Response to Net |
Neutral |
HLIT rose 5 times after 10 earnings reports. |
|
Seasonal Success |
Bearish |
HLIT fell 8.1% in May, rose 5.1% in June in prior years. |
|
Earnings Beats |
Bullish |
HLIT beat Street estimate 12 times after 19 reports. |
|
TTD's Quality Rating of Stock - HLIT - BELOW AVERAGE |
Stock's Performance Chart with Quarterly Earnings Markers vs. S&P 500
Insider Buying in Green - Insider Selling in Red
TTD columnist Leo Fasciocco has covered the stock market for over 30 years. His articles appear in many publications. He has also been a speaker at the Money Show conferences. He has been on television and radio. He is author of many educational articles about stock investing and the book “Guide To High-Performance Investing.”

For information to subscribe to the Ticker Tape Digest Services call: Beverly Owen at 1-480-878-8381.
Distributed by Corona Publishing Enterprises. TickerTape Digest Inc. 1220 W. Sherri, Gilbert, Az. 85233.
TTD “Professional Report” is available on the Web: $100 per month. Password needed. Published daily - around 20 times a month.
TTD Pro Report includes a Morning chart slide show of breakout stocks, a Midsession video-audio show with commentary on breakout stocks and shorts and a Final end of day overall report on breakout stocks for the session, short plays and accumulation plays. There are other features too such as Quick Trades and Long-term Plays.
TTD Daily Report is $39. It covers a Morning slide show of charts of stocks breaking out and a TTD end of day print report covering breakout stocks and shorts.
Credit cards accepted. Payable to Corona Publishing Enterprises.
(The information contained has been prepared from data deemed reliable but there is no guarantee of complete accuracy. Ticker Tape Digest Inc. is not affiliated with any broker, dealer or investment advisor. Nothing in this publication constitutes an offer, recommendation or solicitation to buy or sell any securities. Further research is advised. This report is copyrighted and no redistribution is permitted with out permission.)