![]()
|
|
|
Weekly - Bullish Conservative Investors - Go To TTD Long-Term Plays - Monday, Aprl 29, 2019 |
|
|
Go to Video Show - "How to Make Money With Breakout Stocks |
|---|

By Leo Fasciocco -- TTD
Ticker Tape Digest presents its daily stock market report containing stocks to go long as Breakout Trades, Quick Trades, or Bargain Accumulation Trades.
We also feature stocks under Significant Accumulation that are poised to breakout.
|
Ticker Tape Digest's Daily schedule guide for TTD subscribers 1. Pre-market - check Breakout Watch List and Quick Trades. 2. Morning - (11:30 - 12 A.M.) - check breakout stocks tape and breakout chart slide show. 3. Midday (1 P.M.) check TTD Midsession Report and see market video show. 4. After close (4 P.M.) check final TTD Report for day. Trading Strategies Bullish Aggressive Investors Bullish - "Breakout Stocks" - ideally suited for bull markets and special situation stocks. Potential for large returns. (See Performance) Aggressive Investor Bullish- "Quick Trade Stocks" -ideally suited for entry into top performing issues looking for a small quick profit." (See Performance) Conservative Investors "Bargain Buy Trades for the Long Term." Ideally suited for entry into top performing big cap stocks on pullbacks within overall up trend.(See Performance) Bearish Aggressive Bearish Investors - "Breakdown Stocks" to Sell Short. Ideally suited for bear markets or market pull backs. Potential for large returns (See Performance) |
|---|
The TTD report also contains stocks to short as breakdown plays and as bargain (swing trade) shorts.
Investors should tend to try to go with a strategy that fits with the stock market's trend, unless there is a special situation play.
TTD's Breakout Stocks - Long are
most suitable for aggressive investors seeking ideal entry points into leading stocks, especially during bull markets. They can do extremely well in bull markets with gains of as much as several hundred percent. 
These stocks can also do extremely well during strong market rallies, or if they are in a industry group that is performing very well. They tend to have strong earnings outlooks and are near new-52 week, or all-time highs.
TTD Quick Trade Stocks - Long These are leading issues that have pulled back in recent days, but could move higher soon. They are most suitable for Aggressive Investors willing to trade short term. These stocks will do extremely well during market advances. They have about 74% win rate. During market rally sequences the win rate is even higher. The return is small 3% to 8% in just a few days.
TTD's Bargain Buy Trades - Long - Long Term. These are for conservative bullish Investors These long-term buys are ideally suited for entry into stocks on pull backs within overall up trend. These stocks can give a good return long-term especially during a bull market.
TTD also presents Stocks To Sell or Sell Short. These issues are suitable for aggressive investors willing to take short positions both as trades or for longer-term plays. These stocks will do very well during bear markets or market pull backs.
TTD's Bearish breakdown stocks to sell short. These issues have potential to fall sharply. They often show a technical breakdown and also some fundamental business problem such as weak earnings.
TTD's multi-media updates include a slide-show that presents charts and analysis at midsession. Some times TTD presents feature analysis on stocks and the market. TTD uses Windows Media Files. (WMV).
TTD also presents a "Breakout Watch List" that is up dated daily. This list consists of key stocks in position to breakout. A close watch of this list can put you in the stock just as it breaks out. A good idea is to study the list and be ready to move into a stock quickly as it hits its breakpoint.
TTD often suggests using stop buy orders to enter. It is very important to buy a breakout stock as close as possible to the breakpoint. The idea is to get "elbow room" if the stock should follow through to the upside. This is very important in being successful in making big money with breakout stocks.
It is also essential to have a stop loss strategy for all stocks in which positions are taken. Not every stock will work as expected. It is important for investors to "police" their portfolios and avoid getting trapped in any bad positions.
Quality rating of breakout Two key factors: 1 - Stock near all-time high in price or near a 52-week high. 2 - earnings growth current year is strong. The ideal play is a stock with an Above Average Quality Rating. The stock is near a new high and will have strong earnings. TTD's other ratings are Average and Below Average.
TTD also has special feature sections on Educational Tips on Investing.
To email Mr. Leo Fasciocco leo@tickertapedigest.com.
For service, email Beverly Owen owen@tickertapedigest.com. TTD’s Tel: 1-480-926-1680.
Monday - April 29, 2019
TTD's Breakout Stocks
Stock Market Overview
Total Buy Breakouts so far today - 14
Quality of Breakouts - Above Average
Stocks Screened - 12,234
Bull side - Large list of breakouts Monday with several good looking plays for aggressive bulls.
Stock market - Market averages remain bullish in all time sectors.
Comment - TTD sees the market still holding its overall up trend. Earnings will continue to come in and have an impact on the market averages.
See Latest Earnings Reports - A company that tops the Street's highest earnings estimate has potential to go higher. Earnings beats for Monday - DGICA, SALT, BRKS, AKS, ETH, CYOU, and JBT.
Stock Market Momentum
(Daily is based on a moving average)
|
Market (Daily) |
Market (Weekly) |
Market (Monthly) |
|
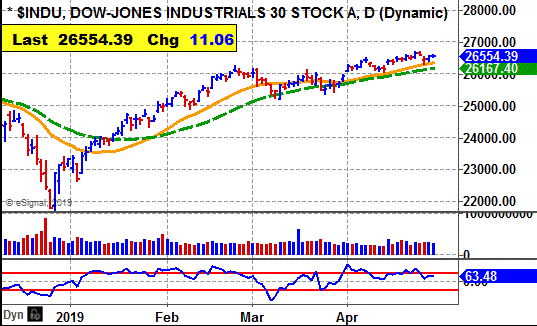
Dow - Bullish |
Dow - Bullish |
Dow - Bullish |
|
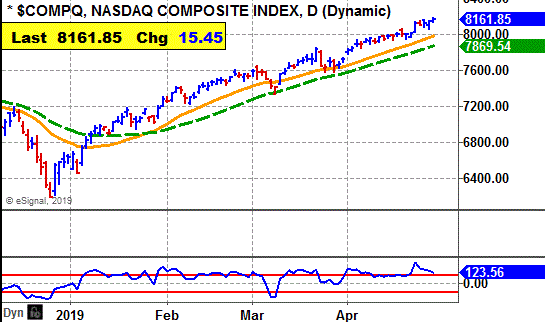
Nasdaq - Bullish |
Nasdaq - Bullish |
Nasdaq - Bullish |
|
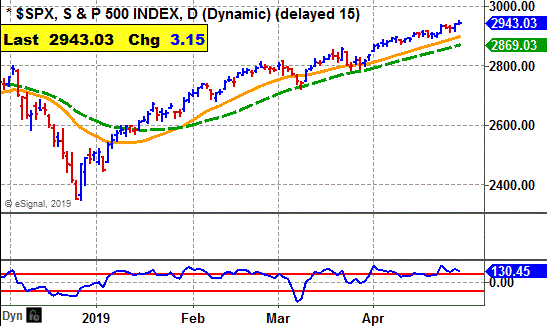
S&P 500 - Bullish |
S&P 500 - Bullish |
S&P 500 - Bullish |
 Ticker Tape Digest's
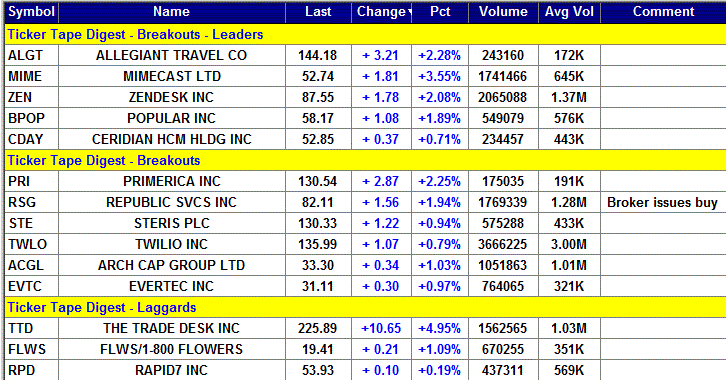
|
TTD's Quality Rating of Stock - MIME - ABOVE AVERAGE |
MIME, based in London, provides cybersecurity to firms an organizations worldwide. Annual revenues:$262 million. MIME's stock rises sharply Monday and breaks out from its 12-week flat base. 
The move carries the stock to a new all-time high. That is bullish.
TTD sees more on the upside. 
So far today, MIME is trading a heavy 1.7 million shares, more than double its average daily volume of 645,000 shares.
TTD highlighted MIME as a breakout at our midsession video show on the Web Monday.
MIME's stock spiked higher in the morning to clear its breakpoint line.
The stock reached an intraday high of $54.09.
MIME then trended sideways the rest of the day holding the bulk of its gain.
Tape Action
MIME's tape action shows the recent block trades.
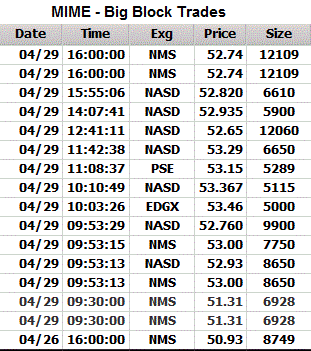 One can see the price for the blocks climbing from $50.93 in the prior session to as high as $53.46 in the morning.
A key bullish trade came in the morning when a block of 8,650 shares crossed the tape at $53.
That was up from the prior block at $51.31 on 6,928 shares.
Near the close a block of 12,109 shares (duplicated) crossed the tape at $52.74.
That came on a down tick sequence from $52.75 on 100 shares.
Business
MIME cloud suite enables firms to implement a cyber resilience strategy.
The system provides email and web security and archive and data protection.
It also provides awareness training, uptime assurance and protection against cyberattacks.
Charts
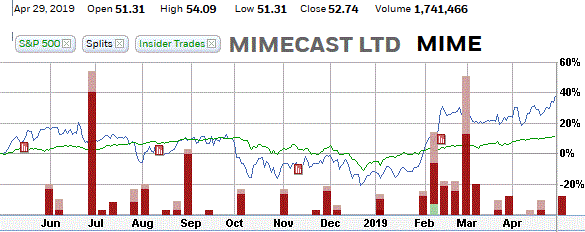
MIME's 12-month performance chart shows the stock up 38% versus a 10% gain for the stock market.
Insiders were recent buyers using stock options at $9.78 a share to $28.
They were recent sellers at $47 to $48 a share.
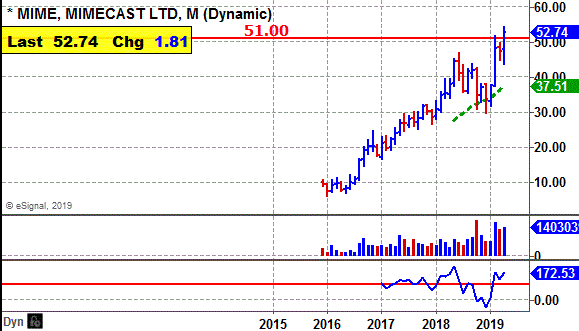
MIME's long-term chart shows the stock coming public in 2015 at $10.10. The stock rose steadily reaching a peak at $46.87 last year.
It then pulled back and based and has since turned higher It is one of the strongest acting stocks in the market. 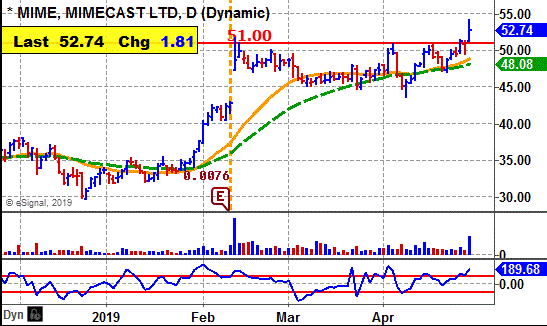
MIME's daily chart shows the stock climbing from $30 back in December to a peak near $51 by February.
The stock then put down a tight flat base.
The breakout Monday comes with expanding volume and a widening of the day daily spread.
That is very bullish.
The stock's CCI momentum indicator is strongly bullish.
Earnings Outlook
This fiscal year ending in March, analysts are forecasting a profit of 27 cents versus a loss of one cent the prior year.
The stock sells with a price-earnings ratio of 192. That is high. So, the stock is most suitable for aggressive bulls.
Looking out to fiscal 2020 ending in March, the Street predicts an 87% jump in net to 51 cents a share from the anticipated 27 cents this year.
Net for the fiscal fourth quarter ending in March should come in at 9 cents a share compared with a loss of 5 cents the year before.
The highest estimate on the Street is at 17 cents a share among 11 analysts. So, some see chances for a big earnings beat
The company topped the Street estimate the prior two quarters by 3 cents a share and 3 cents.
For the fiscal first quarter ending in June, the Street is calling fro a 125% leap in net to 9 cents a share from the 4 cents the year before.
Strategy Opinion: TTD is targeting MIME for a move to $63 within the next few months, or sooner.
A protective stop can be placed near $50.
Intermediate-Term Rating: Average.
Suitability: Very Aggressive Bulls.
TTD's special research of Stock's Prior Performance:
Probability - Breakout Success - Bullish - MIME scored some solid gains off some of its recent breakouts. The stock is in a long-term up trend.
Probability - Earnings Response - Bullish - MIME rose 7 times after the past 9 earnings reports when there was a significant change in price.
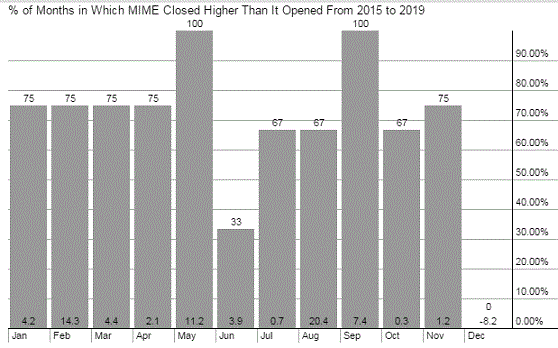
Probability: Seasonal Success - Very Bullish. - MIME averaged a gain of 11.2% in May and a gain of 3.9% in June the past several years.
Stock's Prior Performance After A Breakout
|
Stock's % Change from Breakout to peak - prior to cut below 50-day M/A. |
Date of Breakout |
Break point Price |
Stocks Price Peak after Breakout - prior to cut below 50-day M/A |
Date Trade Closed |
|
40% |
2/1/2019 |
37.55 |
52.74 |
Still in play |
|
16% |
5/7/2018 |
39.35 |
45.94 |
6/20/2018 |
|
21% |
2/12/2018 |
32.01 |
38.67 |
3/9/2018 |
|
10% |
10/4/2017 |
28.94 |
31.79 |
10/31/2017 |
|
26% |
4/26/2017 |
23.39 |
29.46 |
6/7/2017 |
(In actual trading, entry and exit points could vary depending on broker execution.
Also, ideal are breakouts to a new 52-week high or better, perhaps all-time highs.)
Stock's Long-term Chart
Stock's Performance Chart with Quarterly Earnings Markers vs. S&P 500
Insider Buying in Green - Insider Selling in Red
Stock's Monthly Seasonal Performance Chart - Past 5 Years
Showing % Months UP and % Change
| TTD's Breakout Profile Rating Mimecast Ltd. (MIME) |
| TTD Check List | Bullish | Bearish | Neutral |
| Near 52-week High | YES | ||
| Volume | YES | ||
| Tick Volume | YES | ||
| Price Trend - Daily | YES | ||
| Price Trend - Long Term | YES | ||
| Price Daily Spread | YES | ||
| Base Structure | YES | ||
| Base - A-D | YES | ||
| Earnings-Quarterly | YES | ||
| Earnings-Long Term | YES | ||
| Earnings Outlook | YES | ||
| Industry Group | YES | ||
| Prior Breakout Success | YES | ||
| Fund Sponsorship | YES | ||
| Total Score | 13 | 0 | 1 |
Charts of Selected Breakout Stocks
|
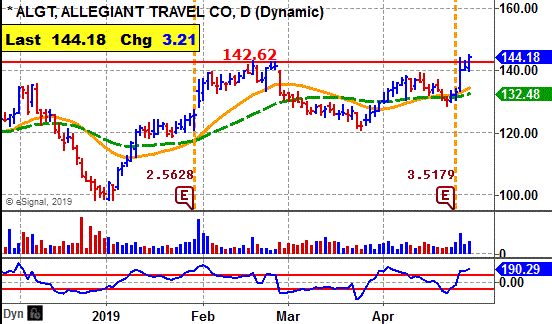
TTD's Quality Rating of Stock - ALGT - AVERAGE |
|
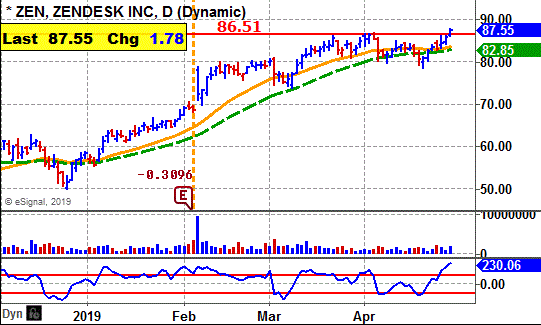
TTD's Quality Rating of Stock - ZEN - AVERAGE |
|
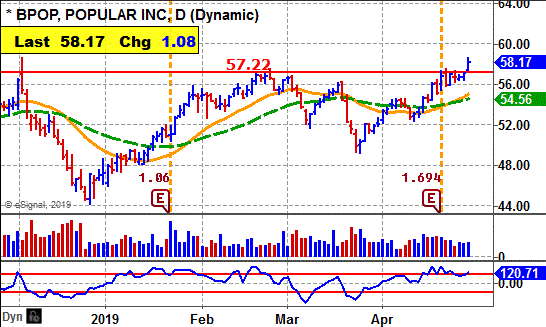
TTD's Quality Rating of Stock - BPOP - AVERAGE |
|
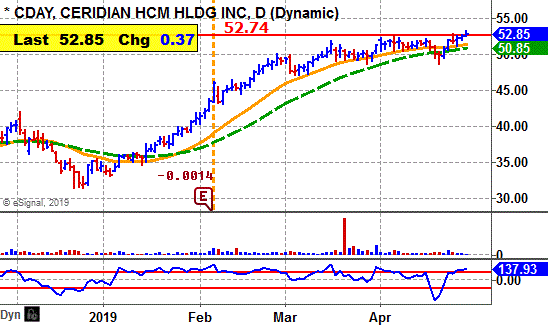
TTD's Quality Rating of Stock - CDAY - AVERAGE |

Ticker Tape Digest’s Daily List of “Stocks To Sell or Sell Short” ranks stocks well timed to be sold immediately based on daily trading. The list can be used as an alert to reduce current long-term positions.
Shorts from tape action so far today - 4
Stocks Screened - 12,234
Long-Term Environment for bears: Unfavorable.
Bear Side - Small list of breakdown stocks. Bears be conservative.
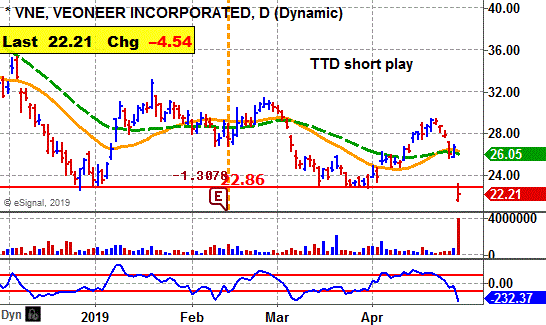
VNR, based in Stockholm, makes and sells auto safety electronic products. Annual revenues: $2.2 billion. VNE's stock falls sharply Monday and undercuts key technical support. 
The decline was triggered by the report of a wider-than-expected quarterly loss.
TTD sees more on the downside.
So far today, VNE is trading a heavy 4.1 million shares, 7 times its average daily volume of 565,000 shares.
VNE reported a first quarter loss of $1.57 a share. The Street was expecting a loss of only $1.18 a share.
VNE's stock gapped lower and undercut key technical support. 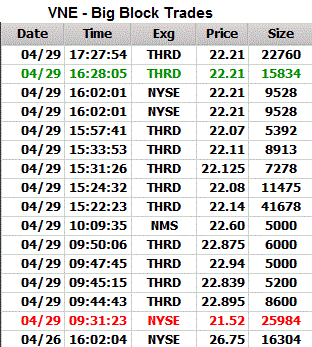
It touched an intraday low of $21.52 in the morning.
It lifted to around $23 and then trended sideways the rest of the day.
Tape Action
VNE's tape action shows the recent block trades.
One can see the price for the blocks falling from $26.75 in the prior session down to $21.52 early on Monday.
A key bearish trade came in the morning when a block of 25,874 shares crossed the tape at $21.52.
That was down from the prior block at $26.75 on 16,304 shares.
Business
VNE's about products cover active safety, restraint control systems and brake systems.
Its brake systems product area consists of ANBS. In addition, within its active safety product area the Company provides ADAS and AD software solutions for vehicle decision and control through its Zenuity joint venture.
The company operates in two segments Electronics and Brake Systems.
Earnings:
This year, analysts are forecasting a loss of $4.04 a share. There was no comparison from a year before.
For the second quarter, analysts expect a loss of $1.03 a share compared with a loss of 72 cents a share the year before.
Charts:
VNE's daily chart shows the stock gapping lower with big volume. The decline sends the stock to an all-time low. That is bearish.
VNE was as high as $57.93 in September.
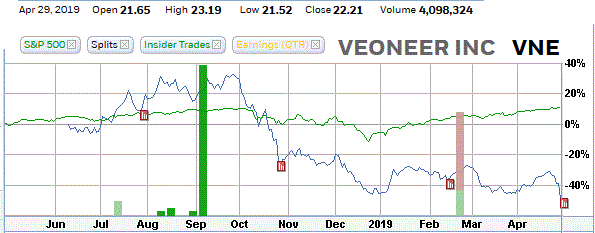
VNE's 12-month performance chart shows the stock down 50% versus an 11% gain for the stock market.
Insiders were buyers last year at $50 to $55 a share in the open market. They have not done any selling.
Strategy Opinion: TTD is targeting VNE for a drop to $18 within the next few months, or sooner. A protective stop buy can be placed near $23.
Suitability: Aggressive Bears.
TTD's probability research of Prior Performance:
Probability - Earnings Response - Bearish. - VNE rose one time after the past 4 earnings reports when there was a significant change in price.
Probability: Seasonal Activity - Bearish. - VNE averaged a breakeven in May and a decline of 4.6% in June the past several years.
|
TTD's Quality Rating of Stock - VNE - BELOW AVERAGE |
Stock's Performance Chart with Quarterly Earnings Markers vs. S&P 500
Insider Buying in Green - Insider Selling in Red
TTD columnist Leo Fasciocco has covered the stock market for over 30 years. His articles appear in many publications. He has also been a speaker at the Money Show conferences. He has been on television and radio. He is author of many educational articles about stock investing and the book “Guide To High-Performance Investing.”

For information to subscribe to the Ticker Tape Digest Services call: Beverly Owen at 1-480-878-8381 or 480-704-3331
Distributed by Corona Publishing Enterprises. TickerTape Digest Inc. 1220 W. Sherri, Gilbert, Az. 85233.
TTD “Professional Report” is available on the Web: $100 per month. Password needed. Published daily - around 20 times a month.
TTD Pro Report includes a Morning chart slide show of breakout stocks, a Midsession video-audio show with commentary on breakout stocks and shorts and a Final end of day overall report on breakout stocks for the session, short plays and accumulation plays. There are other features too such as Quick Trades and Long-term Plays.
TTD Daily Report is $39. It covers a Morning slide show of charts of stocks breaking out and a TTD
end of day print report covering breakout stocks and shorts.
Credit cards accepted. Payable to Corona Publishing Enterprises.
(The information contained has been prepared from data deemed reliable but there is no guarantee of complete accuracy. Ticker Tape Digest Inc. is not affiliated with any broker, dealer or investment advisor. Nothing in this publication constitutes an offer, recommendation or solicitation to buy or sell any securities. Further research is advised. This report is copyrighted and no redistribution is permitted with out permission.)