![]()
|
|
|
|
|
Go to Video Show - "How to Make Money With Breakout Stocks |
|---|

By Leo Fasciocco -- TTD
Ticker Tape Digest presents its daily stock market report containing stocks to go long as Breakout Trades, Quick Trades, or Bargain Accumulation Trades.
We also feature stocks under Significant Accumulation that are poised to breakout.
|
Ticker Tape Digest's Daily schedule guide for TTD subscribers 1. Pre-market - check Breakout Watch List and Quick Trades. 2. Morning - (11:30 - 12 A.M.) - check breakout stocks tape and breakout chart slide show. 3. Midday (1 P.M.) check TTD Midsession Report and see market video show. 4. After close (4 P.M.) check final TTD Report for day. Trading Strategies Bullish Aggressive Investors Bullish - "Breakout Stocks" - ideally suited for bull markets and special situation stocks. Potential for large returns. (See Performance) Aggressive Investor Bullish- "Quick Trade Stocks" -ideally suited for entry into top performing issues looking for a small quick profit." (See Performance) Conservative Investors "Bargain Buy Trades for the Long Term." Ideally suited for entry into top performing big cap stocks on pullbacks within overall up trend.(See Performance) Bearish Aggressive Bearish Investors - "Breakdown Stocks" to Sell Short. Ideally suited for bear markets or market pull backs. Potential for large returns (See Performance) |
|---|
The TTD report also contains stocks to short as breakdown plays and as bargain (swing trade) shorts.
Investors should tend to try to go with a strategy that fits with the stock market's trend, unless there is a special situation play.
TTD's Breakout Stocks - Long are
most suitable for aggressive investors seeking ideal entry points into leading stocks, especially during bull markets. They can do extremely well in bull markets with gains of as much as several hundred percent. 
These stocks can also do extremely well during strong market rallies, or if they are in a industry group that is performing very well. They tend to have strong earnings outlooks and are near new-52 week, or all-time highs.
TTD Quick Trade Stocks - Long These are leading issues that have pulled back in recent days, but could move higher soon. They are most suitable for Aggressive Investors willing to trade short term. These stocks will do extremely well during market advances. They have about 74% win rate. During market rally sequences the win rate is even higher. The return is small 3% to 8% in just a few days.
TTD's Bargain Buy Trades - Long - Long Term. These are for conservative bullish Investors These long-term buys are ideally suited for entry into stocks on pull backs within overall up trend. These stocks can give a good return long-term especially during a bull market.
TTD also presents Stocks To Sell or Sell Short. These issues are suitable for aggressive investors willing to take short positions both as trades or for longer-term plays. These stocks will do very well during bear markets or market pull backs.
TTD's Bearish breakdown stocks to sell short. These issues have potential to fall sharply. They often show a technical breakdown and also some fundamental business problem such as weak earnings.
TTD's multi-media updates include a slide-show that presents charts and analysis at midsession. Some times TTD presents feature analysis on stocks and the market. TTD uses Windows Media Files. (WMV).
TTD also presents a "Breakout Watch List" that is up dated daily. This list consists of key stocks in position to breakout. A close watch of this list can put you in the stock just as it breaks out. A good idea is to study the list and be ready to move into a stock quickly as it hits its breakpoint.
TTD often suggests using stop buy orders to enter. It is very important to buy a breakout stock as close as possible to the breakpoint. The idea is to get "elbow room" if the stock should follow through to the upside. This is very important in being successful in making big money with breakout stocks.
It is also essential to have a stop loss strategy for all stocks in which positions are taken. Not every stock will work as expected. It is important for investors to "police" their portfolios and avoid getting trapped in any bad positions.
Quality rating of breakout Two key factors: 1 - Stock near all-time high in price or near a 52-week high. 2 - earnings growth current year is strong. The ideal play is a stock with an Above Average Quality Rating. The stock is near a new high and will have strong earnings. TTD's other ratings are Average and Below Average.
TTD also has special feature sections on Educational Tips on Investing.
To email Mr. Leo Fasciocco leo@tickertapedigest.com.
For service, email Beverly Owen owen@tickertapedigest.com. TTDÆs Tel: 1-480-878-8381 or 480-704-3331.
Thursday - April 30, 2020
TTD's Breakout Stocks
Stock Market Overview
Total Buy Breakouts - 4
Quality of Breakouts - Below Average.
Stocks Screened - 12,234
Bull side - Small list of breakouts. Bulls be selective.
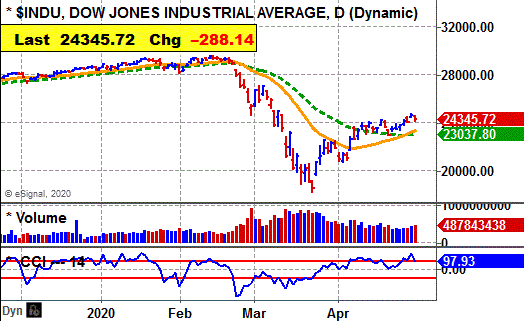
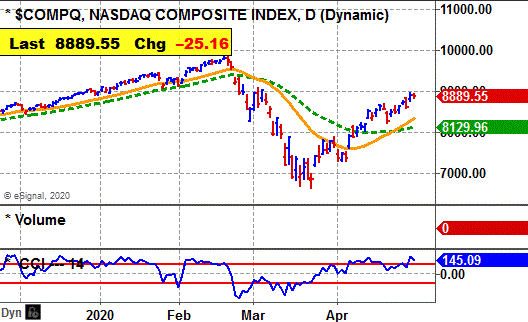
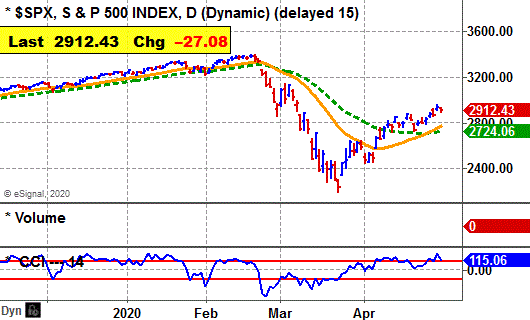
Stock market - Market remains bullish daily. However, the Dow and S&P are bearish weekly and monthly.
Comment - Earnings will be coming and will have an impact on market direction.
See Latest Earnings Reports - A company that tops the Street's highest earnings estimate has potential to go higher. Key earnings beats - BSVN, ABMD, JHG, DAN and TECH.
Stock Market Momentum
(Daily is based on a moving average)
|
Market (Daily) |
Market (Weekly) |
Market (Monthly) |
|
Dow - Bullish |
Dow - Bearish |
Dow - Bearish |
|
Nasdaq - Bullish |
Nasdaq - Bullish |
Nasdaq - Bullish |
|
S&P 500 - Bullish |
S&P 500 - Bearish |
S&P 500 - Bearish |
 Ticker Tape Digest's
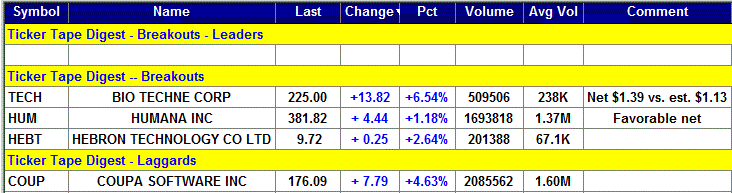
|
TTD's Quality Rating of Stock - TECH - ABOVE AVERAGE |
TECH, based in Minneapolis, Min., sells biotechnology reagents and instruments for the research and clinical diagnostic markets. Annual revenues: $714 million. TECH's stock surges higher Thursday and breaks out from its 16-week, cup-and-handle base. 
So far today, TECH is trading 509,506 shares, double its average daily volume of 238,000 shares.
TTD sees more on the upside.
TECH's big push higher came with earnings beat. The company reported net for the fiscal third quarter ended in March of $1.39 a share.
That beat not only the consensus estimate at $1.13 a share but also the highest estimate on the Street of $1.29 a share.
That is very bullish. 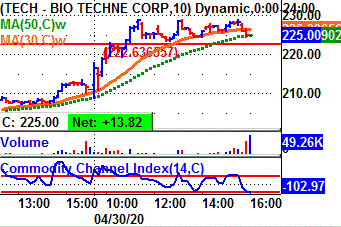
TECH's stock pushed higher in the morning and cleared its breakpoint line.
The stock then trended sideways the rest of the day holding the bulk of its gain.
In after-hours trading, the stock was up 2 cents.
Tape Action
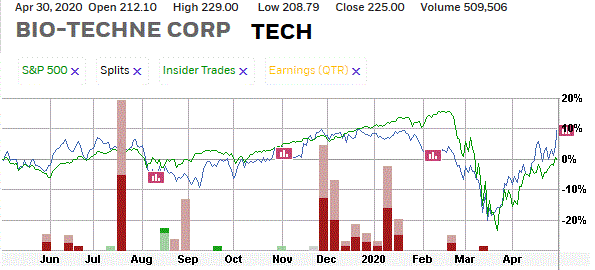
TECH's tape action shows the recent block trades.
One can see the price for the blocks climbing from $208.78 in the morning to as high as $228.40 in the afternoon.
A key bullish trade came in the morning when a block of 1,672 shares (duplicated) crossed the tape at $212.10. 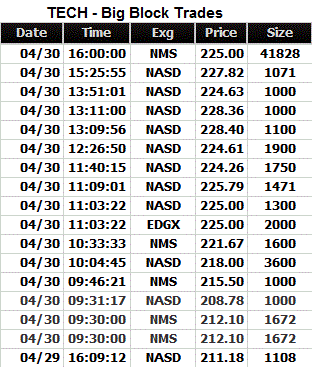
That was up from the prior block at $211.18 on 1,108 shares in the prior session.
Near the close a big block of 41,828 shares crossed at $225.
That was down from the prior block at $227.82 on 1,071 shares. So, the tape would indicate some institutional selling.
Business
The Company operates through two segments: Protein Sciences and Diagnostics and Genomics.
The Protein Sciences reporting segment supplies specialized proteins, such as cytokines and growth factors, immunoassays, antibodies and reagents, to the biotechnology community.
The Protein Sciences segment also provides an array of platforms useful in various areas of protein analysis.
The Diagnostics and Genomics reporting segment provides blood chemistry and blood gas quality controls, hematology instrument controls, diagnostics immunoassays and other bulk and custom reagents for the in vitro diagnostic market.
Charts
TECH's 12-month performance chart shows the stock up 9% versus a breakeven for the stock market.
Insiders were buyers using stock options at $61 to $94 a share.
They were sellers at $198 to 222 a share.
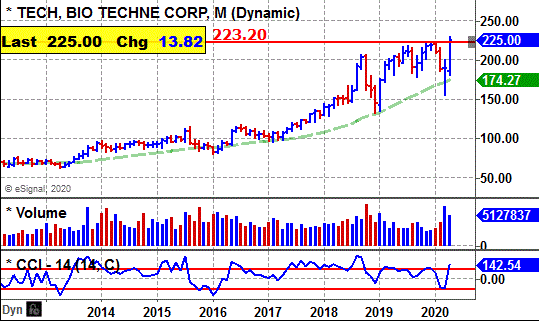
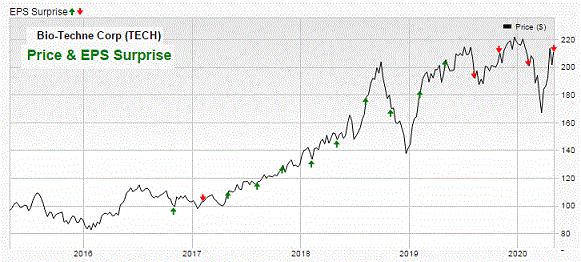
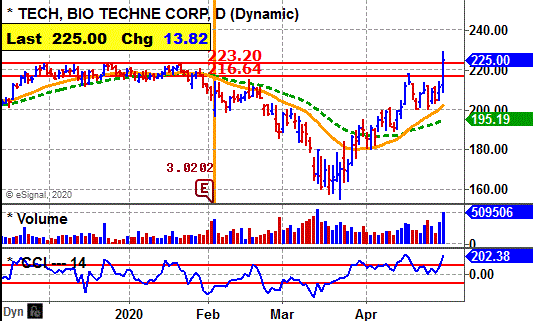 TECH's long-term chart shows the stock climbing from $62 back in 2013 to a peak at $114 by 2015. The stock based and broke out in 2017 and has since soared to $225.
TECH's daily chart shows the stock forming a cup-and-handle base.
The breakout Thursday cuts through a breakpoint zone with a good pick up in volume.
The stock's CCI momentum indicator is strongly bullish.
Earnings Outlook
This fiscal year ending in June, the Street was expecting a 3% decline in net to $4.38 a share from $4.51 the prior year.
However, with the third quarter earnings beat net for the fiscal year ending in June could be as high as $4.65 to $4.70 a share.
Net for the fiscal fourth quarter ending in June should be $1 a share compared with $1.25 the prior year. However, that estimate could be lifted.
Looking out to fiscal 2021 ending in June, the Street predicts a 24% jump in net.
Strategy Opinion: TTD is targeting TECH for a move to $265 within the next few months, or sooner.
A protective stop can be placed near $215.
Intermediate-Term Rating: Average.
Suitability: Average Bulls.
TTD's special research of Stock's Prior Performance:
|
Breakout Success |
Bullish |
TECH scored good gains off recent breakouts. |
|
Response to Net |
Bullish |
TECH rose 10 times after 13 earnings reports. |
|
Seasonal Success |
Bullish |
TECH avg. gain 5% in May, 2.8% in June in prior years. |
|
Earnings Beats |
Bullish |
TECH beat Street net estimate 12 times after 20 reports. |
Stock's Prior Performance After A Breakout
|
Stock's % Change from Breakout to peak - prior to cut below 50-day M/A. |
Date of Breakout |
Break point Price |
Stocks Price Peak after Breakout - prior to cut below 50-day M/A |
Date Trade Closed |
|
23% |
8/7/2018 | 166.73 | 204.11 | 9/28/2018 |
|
18% |
9/6/2017 | 120.27 | 142.11 | 1/25/2018 |
|
32% |
7/18/2013 | 72.37 | 94.66 | 1/7/2014 |
(In actual trading, entry and exit points could vary depending on broker execution.
Also, ideal are breakouts to a new 52-week high or better, perhaps all-time highs.)
Stock's Long-term Chart
Stock's Price Performance after Reporting Earnings
Stock's Performance Chart with Quarterly Earnings Markers vs. S&P 500
Insider Buying in Green - Insider Selling in Red
Charts of Selected Breakout Stocks
|
TTD's Quality Rating of Stock - HUM - AVERAGE |
|
TTD's Quality Rating of Stock - HEBT - AVERAGE |
|
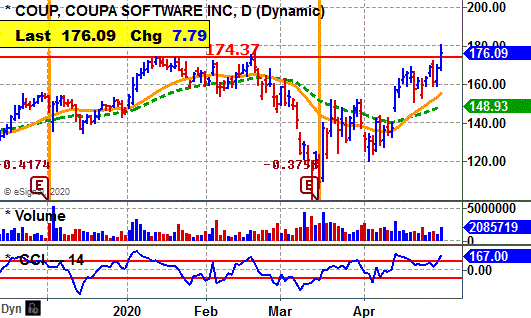
TTD's Quality Rating of Stock - COUP - BELOW AVERAGE |

Ticker Tape DigestÆs Daily List of ōStocks To Sell or Sell Shortö ranks stocks well timed to be sold immediately based on daily trading. The list can be used as an alert to reduce current long-term positions.
Shorts from tape action - 1
Stocks Screened - 12,234
Long-Term Environment for bears: Unfavorable.
Bear Side - Small list of shorts. Bears be conservative. Stock market holding its recent gains off lows.
![]()
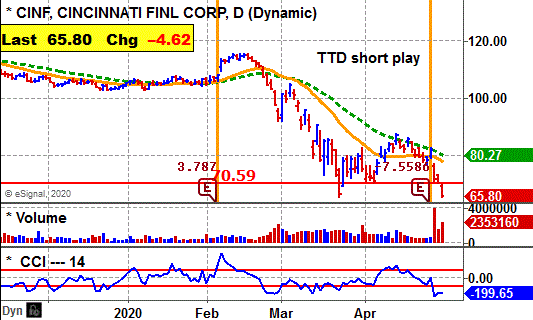
CINF, based in Fairfield, Ohio, provides insurance services. $7.9 billion. CINF's stock falls sharply Thursday and undercuts key technical support with heavy volume. 
So far today, CINF is trading 2.4 million shares, double its average daily volume of 1.1 million shares.
TTD highlighted CINF as a short at our midsession video show on the Web Thursday.
CINF reported a loss of $7.46 a share compared with net of $4.22 the prior year. 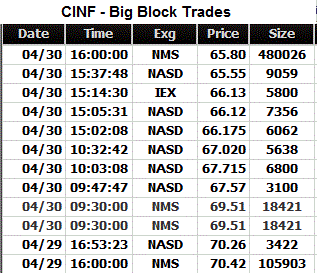
The loss was due to a big decline in net investment income.
TTD sees more on the downside.
CINF's stock fell sharply in the morning and undercut key support. The stock then drifted lower the rest of the day and closed near its low for the session. That is bearish.
Tape Action
CINF's tape action shows the recent block trades.
One can see the price for the blocks falling from $70.42 in the prior session to as low as $65.55 late in the day.
A key bearish trade came in the morning when a block of 18,421 shares (duplicated) crossed the tape at $69.51.
That was down from the prior block at $70.26 on 3,422 shares late on Wednesday.
Business
CINF operates through five segments: Commercial lines insurance, Personal lines insurance, Excess and surplus lines insurance, and Life insurance and Investments.
Its commercial Lines Insurance provides several commercial business lines: commercial casualty, commercial property, commercial auto and workers' compensation.
Its personal lines cover auto and homeowner coverages.
Earnings:
This year, analysts are forecasting a 15% drop in net to $3.57 a share from the $4.20 the year before.
Net for the upcoming second quarter should be down 16% to 71 cents a share from the 85 cents the prior year.
Charts:
CINF's daily chart shows the stock trending lower from $114 in January down to $65 by March. The stock tried to rally, but now rolls over.
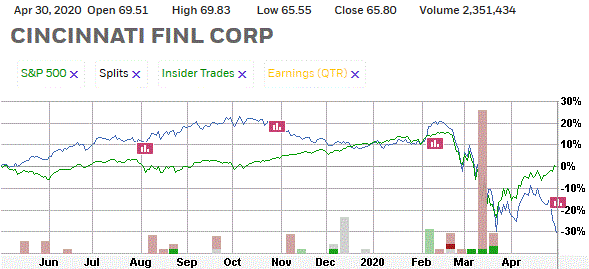
CINF 12-month performance chart shows the stock down 30% versus a breakeven for the stock market.
Strategy Opinion: TTD is targeting CINF for a decline to $58 in the next few months. A protective stop buy can be placed near $69.
Suitability: Conservative Bears.
TTD's Stock Probability research of Prior Performance:
|
Response to Net |
Bullish |
CINF rose 9 times after 12 earnings reports. |
|
Seasonal Success |
Bullish |
CINF up 0.7% in May, 4.1% in June in prior years. |
|
Earnings Beats |
Bullish |
CINF beat Street estimate 18 times after 20 reports. |
|
TTD's Quality Rating of Stock - CINF - BELOW AVERAGE |
Stock's Performance Chart with Quarterly Earnings Markers vs. S&P 500
Insider Buying in Green - Insider Selling in Red
TTD columnist Leo Fasciocco has covered the stock market for over 30 years. His articles appear in many publications. He has also been a speaker at the Money Show conferences. He has been on television and radio. He is author of many educational articles about stock investing and the book ōGuide To High-Performance Investing.ö

For information to subscribe to the Ticker Tape Digest Services call: Beverly Owen at 1-480-878-8381.
Distributed by Corona Publishing Enterprises. TickerTape Digest Inc. 1220 W. Sherri, Gilbert, Az. 85233.
TTD ōProfessional Reportö is available on the Web: $100 per month. Password needed. Published daily - around 20 times a month.
TTD Pro Report includes a Morning chart slide show of breakout stocks, a Midsession video-audio show with commentary on breakout stocks and shorts and a Final end of day overall report on breakout stocks for the session, short plays and accumulation plays. There are other features too such as Quick Trades and Long-term Plays.
TTD Daily Report is $39. It covers a Morning slide show of charts of stocks breaking out and a TTD end of day print report covering breakout stocks and shorts.
Credit cards accepted. Payable to Corona Publishing Enterprises.
(The information contained has been prepared from data deemed reliable but there is no guarantee of complete accuracy. Ticker Tape Digest Inc. is not affiliated with any broker, dealer or investment advisor. Nothing in this publication constitutes an offer, recommendation or solicitation to buy or sell any securities. Further research is advised. This report is copyrighted and no redistribution is permitted with out permission.)