![]()
Daily - Bullish Investors - Go To TTD Pre-Market Opening Breakout Watch List - Friday - May 3, 2019
|
|
Daily - Bullish Investors - Go To TTD Pre-Market Opening Breakout Watch List - Friday - May 3, 2019 |
|
Weekly - Bullish Conservative Investors - Go To TTD Long-Term Plays - Monday, Aprl 29, 2019 |
|
|
Go to Video Show - "How to Make Money With Breakout Stocks |
|---|

By Leo Fasciocco -- TTD
Ticker Tape Digest presents its daily stock market report containing stocks to go long as Breakout Trades, Quick Trades, or Bargain Accumulation Trades.
We also feature stocks under Significant Accumulation that are poised to breakout.
|
Ticker Tape Digest's Daily schedule guide for TTD subscribers 1. Pre-market - check Breakout Watch List and Quick Trades. 2. Morning - (11:30 - 12 A.M.) - check breakout stocks tape and breakout chart slide show. 3. Midday (1 P.M.) check TTD Midsession Report and see market video show. 4. After close (4 P.M.) check final TTD Report for day. Trading Strategies Bullish Aggressive Investors Bullish - "Breakout Stocks" - ideally suited for bull markets and special situation stocks. Potential for large returns. (See Performance) Aggressive Investor Bullish- "Quick Trade Stocks" -ideally suited for entry into top performing issues looking for a small quick profit." (See Performance) Conservative Investors "Bargain Buy Trades for the Long Term." Ideally suited for entry into top performing big cap stocks on pullbacks within overall up trend.(See Performance) Bearish Aggressive Bearish Investors - "Breakdown Stocks" to Sell Short. Ideally suited for bear markets or market pull backs. Potential for large returns (See Performance) |
|---|
The TTD report also contains stocks to short as breakdown plays and as bargain (swing trade) shorts.
Investors should tend to try to go with a strategy that fits with the stock market's trend, unless there is a special situation play.
TTD's Breakout Stocks - Long are
most suitable for aggressive investors seeking ideal entry points into leading stocks, especially during bull markets. They can do extremely well in bull markets with gains of as much as several hundred percent. 
These stocks can also do extremely well during strong market rallies, or if they are in a industry group that is performing very well. They tend to have strong earnings outlooks and are near new-52 week, or all-time highs.
TTD Quick Trade Stocks - Long These are leading issues that have pulled back in recent days, but could move higher soon. They are most suitable for Aggressive Investors willing to trade short term. These stocks will do extremely well during market advances. They have about 74% win rate. During market rally sequences the win rate is even higher. The return is small 3% to 8% in just a few days.
TTD's Bargain Buy Trades - Long - Long Term. These are for conservative bullish Investors These long-term buys are ideally suited for entry into stocks on pull backs within overall up trend. These stocks can give a good return long-term especially during a bull market.
TTD also presents Stocks To Sell or Sell Short. These issues are suitable for aggressive investors willing to take short positions both as trades or for longer-term plays. These stocks will do very well during bear markets or market pull backs.
TTD's Bearish breakdown stocks to sell short. These issues have potential to fall sharply. They often show a technical breakdown and also some fundamental business problem such as weak earnings.
TTD's multi-media updates include a slide-show that presents charts and analysis at midsession. Some times TTD presents feature analysis on stocks and the market. TTD uses Windows Media Files. (WMV).
TTD also presents a "Breakout Watch List" that is up dated daily. This list consists of key stocks in position to breakout. A close watch of this list can put you in the stock just as it breaks out. A good idea is to study the list and be ready to move into a stock quickly as it hits its breakpoint.
TTD often suggests using stop buy orders to enter. It is very important to buy a breakout stock as close as possible to the breakpoint. The idea is to get "elbow room" if the stock should follow through to the upside. This is very important in being successful in making big money with breakout stocks.
It is also essential to have a stop loss strategy for all stocks in which positions are taken. Not every stock will work as expected. It is important for investors to "police" their portfolios and avoid getting trapped in any bad positions.
Quality rating of breakout Two key factors: 1 - Stock near all-time high in price or near a 52-week high. 2 - earnings growth current year is strong. The ideal play is a stock with an Above Average Quality Rating. The stock is near a new high and will have strong earnings. TTD's other ratings are Average and Below Average.
TTD also has special feature sections on Educational Tips on Investing.
To email Mr. Leo Fasciocco leo@tickertapedigest.com.
For service, email Beverly Owen owen@tickertapedigest.com. TTD’s Tel: 1-480-926-1680.
Friday - May 3, 2019
TTD's Breakout Stocks
Stock Market Overview
Total Buy Breakouts so far today - 16
Quality of Breakouts - Average
Stocks Screened - 12,234
Bull side - Large list of breakouts with some good looking plays. Bulls can be venturesome.
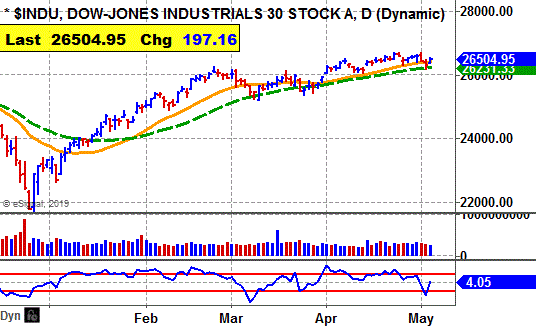
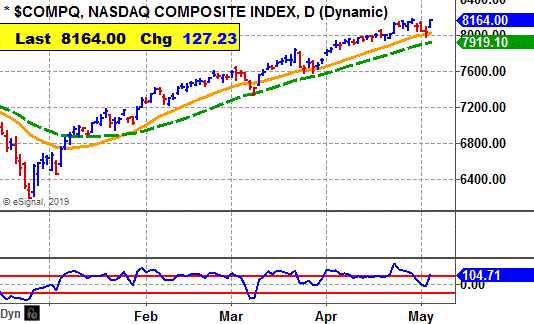
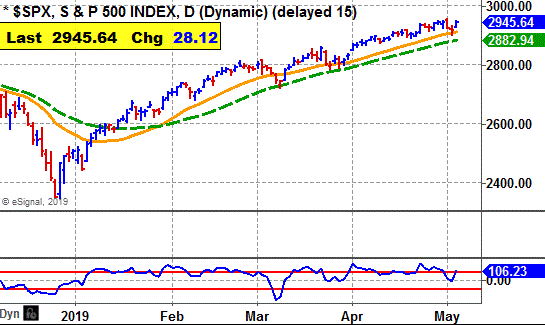
Stock market - Market averages are now bullish in all time sectors.
Comment - Big flood of earnings coming next week. Bulls need to be alert.
See Latest Earnings Reports - A company that tops the Street's highest earnings estimate has potential to go higher. Some key earnings beats for Friday - NWL, ASIX, XRAY, HMSY, SNR and JOUT.
Stock Market Momentum
(Daily is based on a moving average)
|
Market (Daily) |
Market (Weekly) |
Market (Monthly) |
|
Dow - Bullish |
Dow - Bullish |
Dow - Bullish |
|
Nasdaq - Bullish |
Nasdaq - Bullish |
Nasdaq - Bullish |
|
S&P 500 - Bullish |
S&P 500 - Bullish |
S&P 500 - Bullish |
 Ticker Tape Digest's
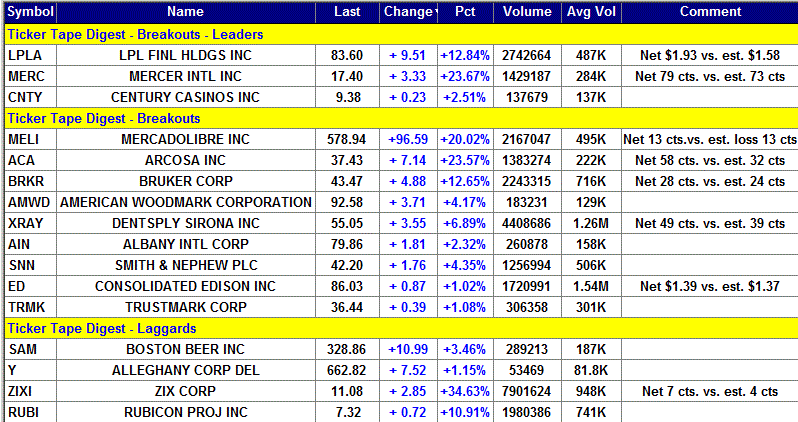
|
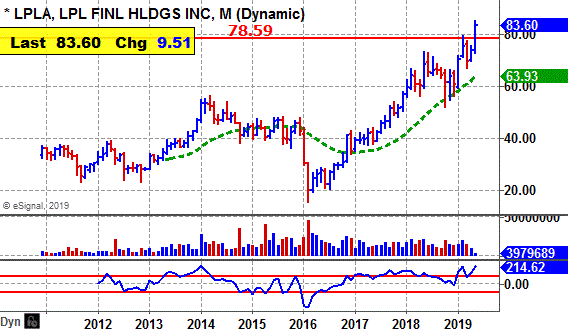
TTD's Quality Rating of Stock - LPLA - ABOVE AVERAGE |
LPLA, based in Boston, is a broker-dealer, a custodian for registered investment advisors and a consultant to retirement plans. Annual revenues: $5.2 billion. LPLA's stock drives higher Friday breaking out from a 12-week, flat base. 
The move was triggered by strong earnings.
So far today, LPLA is trading a heavy 2.7 million shares, five times its average daily volume of 487,000 shares.
TTD highlighted LPLA as a breakout at our midsession video show on the Web. TTD sees more on the upside. 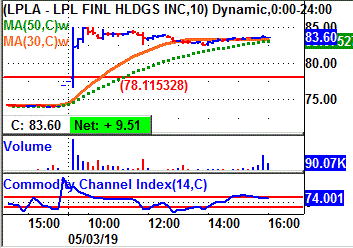
LPLA's 10-minute chart shows the stock gapping higher in the morning and clearing its breakpoint line.
The stock reached an intraday high of $85 and held most of the gain through the day.
LPLA reported earnings for the first quarter of $1.93 a share. That topped the consensus estimate of $1.58 a share.
Tape Action
LPLA's tape action shows the price of its blocks rising from %74.01 in the prior session to as high as $83.60.
A key bullish trade came late on Thursday when a block of 34,498 shares (duplicated) crossed the tape at $74.09.
That was up from the prior block at $74.01 on 10,000 shares. 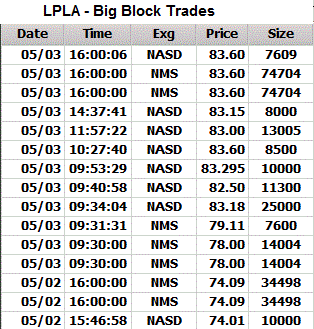
Then near the close Friday a massive block of 74,704 shares (duplicated) crossed at $83.60.
That was up from the prior block at $83.15 on 8,000 shares.
Business
LPLA provides a platform of brokerage and investment advisory services to financial advisors in the U.S. .
It also supports 4,000 financial advisors, affiliated and licensed with insurance companies through customized clearing services, advisory platforms and technology.
LPLA's technology helps advisors to manage their businesses. It automates processes such as account opening and management, document imaging.
Charts
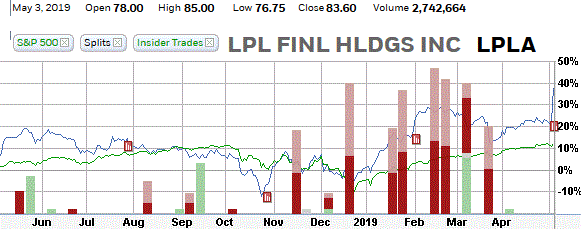
LPLA's 12 month performance chart shows the stock up 38% versus an 11% gain for the stock market.
Insiders were recent buyers using stock options at $18 to $36 a share.
They were sellers at $60 to $77 a share.
LPLA's long-term chart shows the stock coming public back in 2010 at $33.53. The stock rose to a peak at $56 in early 2014.
However, it fell to $15 by early 2016. Since then, LPLA has been trending aggressively higher. The new high Friday is very bullish. 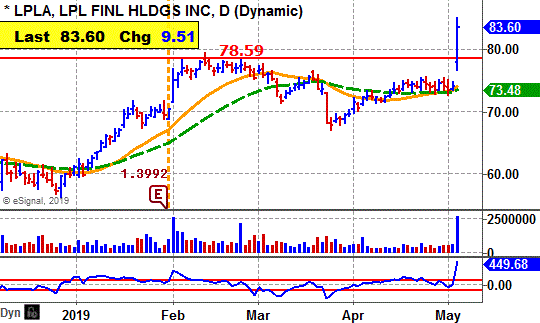
LPLA's daily chart shows the stock advancing from near $60 back in January to a peak at $78 by February.
The stock pulled back and formed a flat base with two shakeouts to the downside.
Friday, LPLA gaps higher and clears its breakpoint with a big expansion in volume.
The stock's CCI momentum indicator is strongly bullish.
Earnings Outlook
This year, analysts are forecasting a 22% increase in net to $6.48 a share from the $5.33 the year before.
The stock sells with a price-earnings ratio of 12. That is low given the earnings growth rate.
Going out to 2020, the Street is predicting a modest 8% rise in net to $6.97 a share from the anticipated $6.48 this year.
Net for the upcoming second quarter should leap 28% to $1.67 a share from the $1.30 the year before.
The highest estimate on the Street is at $1.71 a share.
TTD sees chances for a "beat." The company topped the consensus estimate the past four quarters by 33 cents a share, 12 cents, 6 cents and 10 cents.
Profits for the third quarter should climb 20% to $1.58 a share from the $1.32 the year before.
Strategy Opinion: TTD is targeting LPLA for a move to $105 within the next few months.
A protective stop can be placed near $79.
Intermediate-Term Rating: Average.
Suitability: Average Bulls.
TTD's special research of Stock's Prior Performance:
Probability - Breakout Success - Bullish - LPLA scored some solid gains off some of its recent breakouts. The stock is in a long-term up trend.
Probability - Earnings Response - Bullish - LPLA rose 7 times after the past 9 earnings reports when there was a significant change in price.
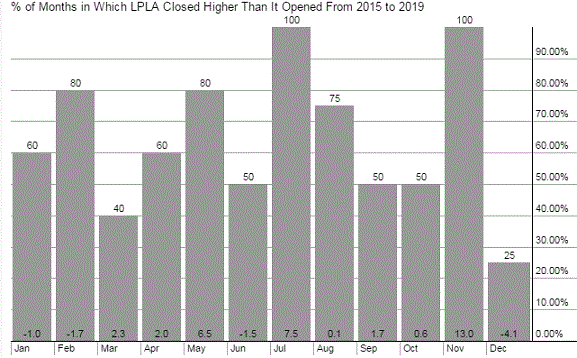
Probability: Seasonal Success - Slightly Bullish. - LPLA averaged a gain of 6.59% in May but a loss of 1.5% in June the past several years.
Stock's Prior Performance After A Breakout
|
Stock's % Change from Breakout to peak - prior to cut below 50-day M/A. |
Date of Breakout |
Break point Price |
Stocks Price Peak after Breakout - prior to cut below 50-day M/A |
Date Trade Closed |
|
17% |
1/15/2019 |
66.30 |
77.93 |
2/19/2019 |
|
21% |
12/4/2017 |
53.79 |
65.45 |
3/9/2018 |
|
13% |
9/18/2017 |
47.01 |
53.30 |
10/6/2017 |
|
47% |
10/4/2016 |
28.76 |
42.45 |
12/1/2016 |
(In actual trading, entry and exit points could vary depending on broker execution.
Also, ideal are breakouts to a new 52-week high or better, perhaps all-time highs.)
Stock's Long-term Chart
Stock's Performance Chart with Quarterly Earnings Markers vs. S&P 500
Insider Buying in Green - Insider Selling in Red
Stock's Monthly Seasonal Performance Chart - Past 5 Years
Showing % Months UP and % Change
| TTD's Breakout Profile Rating LPL Financial Holdings Inc. (LPLA) |
| TTD Check List | Bullish | Bearish | Neutral |
| Near 52-week High | YES | ||
| Volume | YES | ||
| Tick Volume | YES | ||
| Price Trend - Daily | YES | ||
| Price Trend - Long Term | YES | ||
| Price Daily Spread | YES | ||
| Base Structure | YES | ||
| Base - A-D | YES | ||
| Earnings-Quarterly | YES | ||
| Earnings-Long Term | YES | ||
| Earnings Outlook | YES | ||
| Industry Group | YES | ||
| Prior Breakout Success | YES | ||
| Fund Sponsorship | YES | ||
| Total Score | 14 | 0 | 0 |
Charts of Selected Breakout Stocks
|
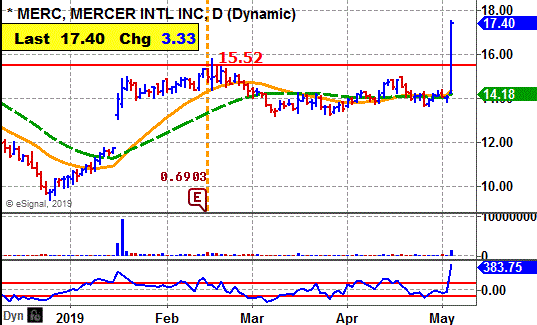
TTD's Quality Rating of Stock - MERC - ABOVE AVERAGE |
|
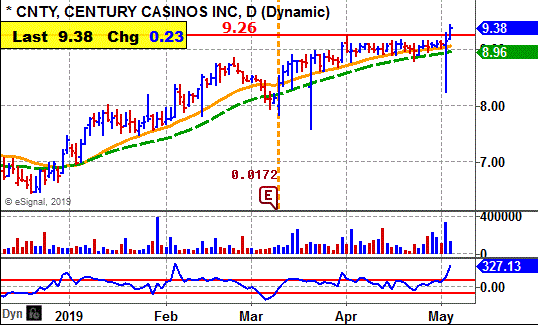
TTD's Quality Rating of Stock - CNTY - ABOVE AVERAGE |
|
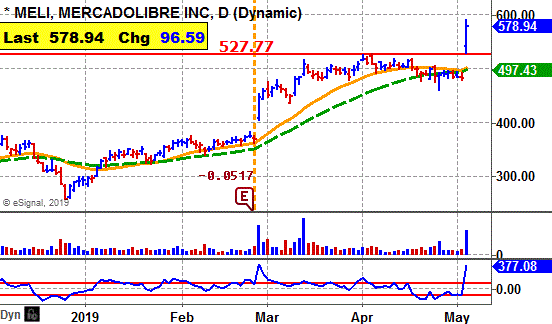
TTD's Quality Rating of Stock - MELI - AVERAGE |
|
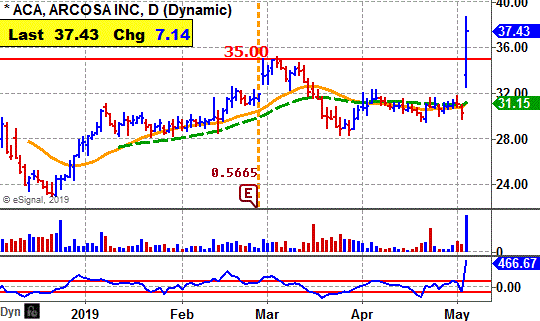
TTD's Quality Rating of Stock - ACA - AVERAGE |

Ticker Tape Digest’s Daily List of “Stocks To Sell or Sell Short” ranks stocks well timed to be sold immediately based on daily trading. The list can be used as an alert to reduce current long-term positions.
Shorts from tape action so far today - 8
Stocks Screened - 12,234
Long-Term Environment for bears: Unfavorable.
Bear Side - Large list of breakdown stocks with some interesting plays. Disappointing earnings sending several stocks down.
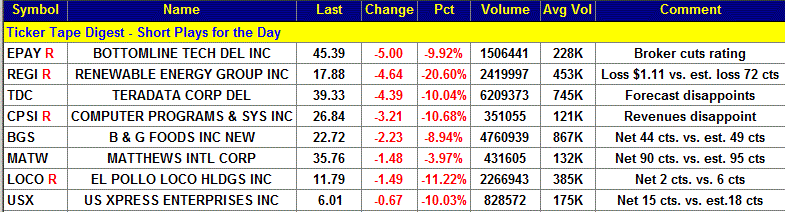
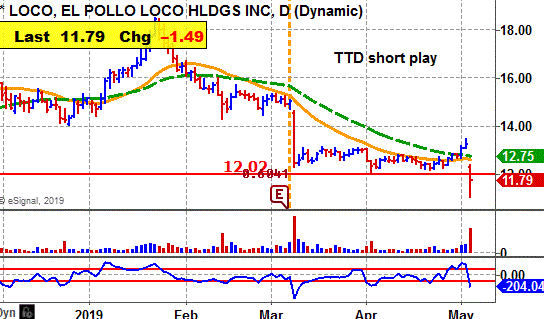
LOCO, based in Costa Mesa, Ca., operates restaurants selling mostly Mexican style food. Annual revenues: $436 million. LOCO's stock falls sharply Friday after reporting disappointing earnings for the first quarter. 
TTD sees more on the downside. TTD highlighted LOCO as a short at our midsession video show on the Web Friday.
So far today, LOCO is trading a heavy 2.3 million shares, five times its average daily volume of 385,000 shares.
LOCO's stock fell sharply in the morning and undercut key technical support.
The stock fell to an intraday low of $11.05 in the morning. It lifted slightly to around 12 and then trended mostly sideways the rest of the day. 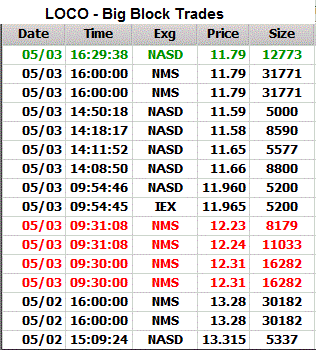
The company reported earnings for the first quarter of 2 cents a share. That was well below the Street estimate of 6 cents a share.
Tape Action
LOCO's tape action shows the recent block trades.
One can see the price for the blocks falling from $13.31 in the prior session to as low as $11.58 Friday.
A key bearish trade came in the morning when a block of 16,282 shares (duplicated) crossed the tape at $12.31.
That was down sharply from the prior block at $13.28 on 30,182 shares late on Thursday.
Business
LOCO's menu features its signature product, citrus-marinated fire-grilled chicken, and a range of Mexican-inspired entrees that it creates from chicken.
The company also offers burritos, salads, tostadas, bowls, stuffed quesadillas and chicken entrees.
LOCO has 460 restaurants, 201 company-operated and 259 franchised.
Earnings:
This year analysts have been forecasting flat earnings at 74 cents a share. Currently, four analysts follow the stock.
Net for the upcoming second quarter is expected to rise 5% to 23 cents a share from the 22 cents the year before.
Charts:
LOCO's stock has been in a down trend after peaking at $18.47 earlier this year.
The stock's breakdown cuts below long-term support. That is bearish.
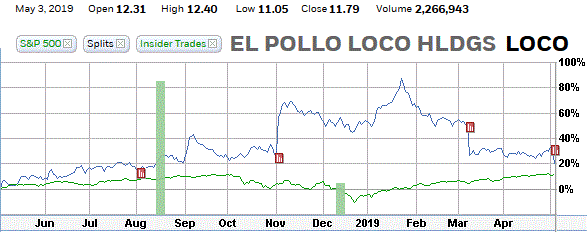
LOCO's 12-month performance chart shows the stock up 20% versus a 10% gain for the stock market.
However, the past two months the stock has been falling sharply.
Strategy Opinion: TTD is targeting LOCO for a decline to $8.50 within the next few months, or sooner. A protective stop buy can be placed near $12.50.
Suitability: Aggressive Bears.
TTD's probability research of Prior Performance:
Probability - Earnings Response - Bearish. - LOCO rose 3 times after the past 8 earnings reports when there was a significant change in price.
Probability: Seasonal Activity Neutral - LOCO averaged a decline of 5.9% in May but a gain of 6.4% in June the past several years.
|
TTD's Quality Rating of Stock - LOCO - BELOW AVERAGE |
Stock's Performance Chart with Quarterly Earnings Markers vs. S&P 500
Insider Buying in Green - Insider Selling in Red
TTD columnist Leo Fasciocco has covered the stock market for over 30 years. His articles appear in many publications. He has also been a speaker at the Money Show conferences. He has been on television and radio. He is author of many educational articles about stock investing and the book “Guide To High-Performance Investing.”

For information to subscribe to the Ticker Tape Digest Services call: Beverly Owen at 1-480-878-8381 or 480-704-3331
Distributed by Corona Publishing Enterprises. TickerTape Digest Inc. 1220 W. Sherri, Gilbert, Az. 85233.
TTD “Professional Report” is available on the Web: $100 per month. Password needed. Published daily - around 20 times a month.
TTD Pro Report includes a Morning chart slide show of breakout stocks, a Midsession video-audio show with commentary on breakout stocks and shorts and a Final end of day overall report on breakout stocks for the session, short plays and accumulation plays. There are other features too such as Quick Trades and Long-term Plays.
TTD Daily Report is $39. It covers a Morning slide show of charts of stocks breaking out and a TTD end of day print report covering breakout stocks and shorts.
Credit cards accepted. Payable to Corona Publishing Enterprises.
(The information contained has been prepared from data deemed reliable but there is no guarantee of complete accuracy. Ticker Tape Digest Inc. is not affiliated with any broker, dealer or investment advisor. Nothing in this publication constitutes an offer, recommendation or solicitation to buy or sell any securities. Further research is advised. This report is copyrighted and no redistribution is permitted with out permission.)