![]()
Daily - Bullish Investors - Go To TTD Pre-Market Opening Breakout Watch List - Tuesday - May 7, 2019
|
|
Daily - Bullish Investors - Go To TTD Pre-Market Opening Breakout Watch List - Tuesday - May 7, 2019 |
|
Weekly - Bullish Conservative Investors - Go To TTD Long-Term Plays - Monday, May 6, 2019 |
|
|
Go to Video Show - "How to Make Money With Breakout Stocks |
|---|

By Leo Fasciocco -- TTD
Ticker Tape Digest presents its daily stock market report containing stocks to go long as Breakout Trades, Quick Trades, or Bargain Accumulation Trades.
We also feature stocks under Significant Accumulation that are poised to breakout.
|
Ticker Tape Digest's Daily schedule guide for TTD subscribers 1. Pre-market - check Breakout Watch List and Quick Trades. 2. Morning - (11:30 - 12 A.M.) - check breakout stocks tape and breakout chart slide show. 3. Midday (1 P.M.) check TTD Midsession Report and see market video show. 4. After close (4 P.M.) check final TTD Report for day. Trading Strategies Bullish Aggressive Investors Bullish - "Breakout Stocks" - ideally suited for bull markets and special situation stocks. Potential for large returns. (See Performance) Aggressive Investor Bullish- "Quick Trade Stocks" -ideally suited for entry into top performing issues looking for a small quick profit." (See Performance) Conservative Investors "Bargain Buy Trades for the Long Term." Ideally suited for entry into top performing big cap stocks on pullbacks within overall up trend.(See Performance) Bearish Aggressive Bearish Investors - "Breakdown Stocks" to Sell Short. Ideally suited for bear markets or market pull backs. Potential for large returns (See Performance) |
|---|
The TTD report also contains stocks to short as breakdown plays and as bargain (swing trade) shorts.
Investors should tend to try to go with a strategy that fits with the stock market's trend, unless there is a special situation play.
TTD's Breakout Stocks - Long are
most suitable for aggressive investors seeking ideal entry points into leading stocks, especially during bull markets. They can do extremely well in bull markets with gains of as much as several hundred percent. 
These stocks can also do extremely well during strong market rallies, or if they are in a industry group that is performing very well. They tend to have strong earnings outlooks and are near new-52 week, or all-time highs.
TTD Quick Trade Stocks - Long These are leading issues that have pulled back in recent days, but could move higher soon. They are most suitable for Aggressive Investors willing to trade short term. These stocks will do extremely well during market advances. They have about 74% win rate. During market rally sequences the win rate is even higher. The return is small 3% to 8% in just a few days.
TTD's Bargain Buy Trades - Long - Long Term. These are for conservative bullish Investors These long-term buys are ideally suited for entry into stocks on pull backs within overall up trend. These stocks can give a good return long-term especially during a bull market.
TTD also presents Stocks To Sell or Sell Short. These issues are suitable for aggressive investors willing to take short positions both as trades or for longer-term plays. These stocks will do very well during bear markets or market pull backs.
TTD's Bearish breakdown stocks to sell short. These issues have potential to fall sharply. They often show a technical breakdown and also some fundamental business problem such as weak earnings.
TTD's multi-media updates include a slide-show that presents charts and analysis at midsession. Some times TTD presents feature analysis on stocks and the market. TTD uses Windows Media Files. (WMV).
TTD also presents a "Breakout Watch List" that is up dated daily. This list consists of key stocks in position to breakout. A close watch of this list can put you in the stock just as it breaks out. A good idea is to study the list and be ready to move into a stock quickly as it hits its breakpoint.
TTD often suggests using stop buy orders to enter. It is very important to buy a breakout stock as close as possible to the breakpoint. The idea is to get "elbow room" if the stock should follow through to the upside. This is very important in being successful in making big money with breakout stocks.
It is also essential to have a stop loss strategy for all stocks in which positions are taken. Not every stock will work as expected. It is important for investors to "police" their portfolios and avoid getting trapped in any bad positions.
Quality rating of breakout Two key factors: 1 - Stock near all-time high in price or near a 52-week high. 2 - earnings growth current year is strong. The ideal play is a stock with an Above Average Quality Rating. The stock is near a new high and will have strong earnings. TTD's other ratings are Average and Below Average.
TTD also has special feature sections on Educational Tips on Investing.
To email Mr. Leo Fasciocco leo@tickertapedigest.com.
For service, email Beverly Owen owen@tickertapedigest.com. TTDÆs Tel: 1-480-926-1680.
Tuesday - May 7, 2019
TTD's Breakout Stocks
Stock Market Overview
Total Buy Breakouts so far today - 6
Quality of Breakouts - Below Average
Stocks Screened - 12,234
Bull side - Very selective list of breakouts. Bulls be conservative.
Stock market - Market averages on the daily sector are all bearish. The other time zones are still holding bullish.
Comment - TTD sees the stock market in a consolidation pattern now. Earnings will still impact individual stocks.
See Latest Earnings Reports - A company that tops the Street's highest earnings estimate has potential to go higher. Key earnings beats for Tuesday - None.
Stock Market Momentum
(Daily is based on a moving average)
|
Market (Daily) |
Market (Weekly) |
Market (Monthly) |
|
Dow - Bearish |
Dow - Bullish |
Dow - Bullish |
|
Nasdaq - Bearish |
Nasdaq - Bullish |
Nasdaq - Bullish |
|
S&P 500 - Bearish |
S&P 500 - Bullish |
S&P 500 - Bullish |
 Ticker Tape Digest's
|
TTD's Quality Rating of Stock - DCO - ABOVE AVERAGE |
DCO, based in Carson, Ca., produces special products for the aerospace, defense and medical industries. Annual revenues: $629 million. 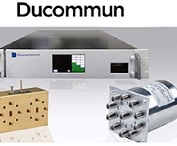
DCO's stock breaks out Tuesday from an 11-week flat base. The move carries the stock to a new all-time high. That is bullish.
TTD sees more on the upside.
So far today, DCO is trading a heavy 251,000 shares, triple its average daily volume of 69,000 shares.
DCO reported net for the first quarter of 64 cents a share, up from 22 cents the year before. The 64 cents also topped the consensus estimate on the Street at 44 cents a share. 
DCO's stock gapped higher at the opening and cleared its breakpoint line.
The stock touched an intraday high of $50.13.
It then backed off a bit and trended sideways the rest of the day around the $48 area.
Tape Action
DCO's tape action shows the recent block trades.
One can see the price for the blocks climbing from $42.56 in the prior session to as high as $49.50 Tuesday morning.
A key bullish trade came late on Monday when a block of 1,000 shares crossed the tape at $46.69.
That was up sharply from the prior block at $42.56 on 5,417 shares. 
Business
DCO handles engineering and manufacturing products used in the aerospace, defense, industrial, natural resources and medical industries.
The company is a solution-based provider offering a range of value-added products.
DCO products include complex cable assemblies and interconnect systems, printed circuit boards and electromechanical and mechanical assemblies.
The firm's customers include commercial aircraft, military fixed-wing aircraft, and military and commercial rotary-wing aircraft.
Charts
DCO's 12-month performance chart shows the stock up 60% versus a 10% gain for the stock market.
Insiders were recent buyer using stock options at $16 to $22 a share.
They were sellers at $38 to $45 a share.
DCO's long-term chart shows the stock climbing from $12 back in early 2016 to peak of 48 this year. 
DCO's daily chart shows the stock climbing from $35 back in December to a peak at $46 by march.
The stock put down a base. However, there was a sharp shakeout in late April.
DCO rallied slightly and now on Tuesday it gaps out of the base with big volume triggered by the favorable earnings.
The stock's CCI momentum indicator is solidly bullish.
Earnings Outlook
This year, analysts are forecasting a 209% surge in net to $2.38 a share from the 77 cents the year before.
The stock sells with a price-earnings ratio of 17. TTD sees that as attractive for value investors.
Net for the second quarter is expected to surge 279% to 53 cents a share from the 14 cents the year before.
The highest estimate on the Street is at 72 cents a share.
Looking out to the third quarter, net is projected to leap 81% to 65 cents a share from the 36 cents the year before.
Strategy Opinion: TTD is targeting DCO for a move to $56 within the next few months.
A protective stop can be placed near $45
Intermediate-Term Rating: Average.
Suitability: Average Bulls.
TTD's special research of Stock's Prior Performance:
Probability - Breakout Success - Bullish - DCO scored modest gains off some of its recent breakouts. The stock is in a long-term up trend.
Probability - Earnings Response - Bullish - DCO rose 6 times after the past 9 earnings reports when there was a significant change in price.
Probability: Seasonal Success - Very Bullish. - DCO averaged a gain of 5.2% in May and a gain of 6.1% in June the past several years.
Stock's Prior Performance After A Breakout
|
Stock's % Change from Breakout to peak - prior to cut below 50-day M/A. |
Date of Breakout |
Break point Price |
Stocks Price Peak after Breakout - prior to cut below 50-day M/A |
Date Trade Closed |
|
7% |
11/6/2018 |
41.29 |
44.23 |
11/7/2018 |
|
14% |
8/7/2018 |
35.61 |
40.81 |
8/30/3018 |
|
12% |
5/8/2018 |
31.55 |
35.43 |
6/11/2018 |
|
20% |
11/10/2016 |
24.44 |
29.46 |
12/5/2016 |
(In actual trading, entry and exit points could vary depending on broker execution.
Also, ideal are breakouts to a new 52-week high or better, perhaps all-time highs.)
Stock's Long-term Chart
Stock's Performance Chart with Quarterly Earnings Markers vs. S&P 500
Insider Buying in Green - Insider Selling in Red
Stock's Monthly Seasonal Performance Chart - Past 5 Years
Showing % Months UP and % Change
| TTD's Breakout Profile Rating Ducommun Inc. (DCO) |
| TTD Check List | Bullish | Bearish | Neutral |
| Near 52-week High | YES | ||
| Volume | YES | ||
| Tick Volume | YES | ||
| Price Trend - Daily | YES | ||
| Price Trend - Long Term | YES | ||
| Price Daily Spread | YES | ||
| Base Structure | YES | ||
| Base - A-D | YES | ||
| Earnings-Quarterly | YES | ||
| Earnings-Long Term | YES | ||
| Earnings Outlook | YES | ||
| Industry Group | YES | ||
| Prior Breakout Success | YES | ||
| Fund Sponsorship | YES | ||
| Total Score | 14 | 0 | 0 |
Charts of Selected Breakout Stocks
|
TTD's Quality Rating of Stock - ATKR - AVERAGE |
|
TTD's Quality Rating of Stock - SERV - AVERAGE |
|
TTD's Quality Rating of Stock - GWPH - AVERAGE |
|
TTD's Quality Rating of Stock - EVBG - AVERAGE |

Ticker Tape DigestÆs Daily List of ōStocks To Sell or Sell Shortö ranks stocks well timed to be sold immediately based on daily trading. The list can be used as an alert to reduce current long-term positions.
Shorts from tape action so far today - 13
Stocks Screened - 12,234
Long-Term Environment for bears: Neutral.
Bear Side - Large list of breakdown stocks as stock market falls sharply. Bears can be venturesome.
AMAG, based in Waltham, Ma., is a drug firm with products to treat maternal health and anemia. Annual revenues: $474 million. AMAG's stock falls sharply Tuesday after reporting a loss for the first quarter. 
TTD sees more on the downside.
So far today, AMAG is trading a heavy 1.4 million shares, almost triple its average daily volume of 538,000 shares. 
AMAG reported for the first quarter a loss of $3.54 a share which included an impact from the acquisition of Perosphere Pharmaceuticals
AMAG's stock fell sharply in the morning and then undercut key technical support.
The stock touched an intraday low of $10.12 in the early afternoon. It then lifted slightly late in the day.
Tape Action
AMAG's tape action shows the recent block trades.
One can see the price for the blocks falling from$11.89 in the prior session to as low as $10.25 in the afternoon.
A key bearish trade came in the morning when a block of 10,000 shares crossed the tape at $10.70.
That was down from the prior block at $11.89 on 61,251 shares late on Monday.
Business
AMAG makes products to treat maternal health, anemia and cancer.
The company is developing Digoxin immune fab, a polyclonal antibody to treat severe preeclampsia in pregnant women.
Its drug is targeted to reduce the risk of preterm birth in women pregnant with a single baby having a history of singleton spontaneous preterm birth.
Earnings:
This year, analysts are forecasting a loss of $2.92 a share compared with a loss of $3.88 the year before.
Looking out to 2020, the Street is expecting a loss of $3.74 a share.
Charts:
AMAG's daily chart shows the stock cutting below support with expanding volume. The move is a continuation of the stock's down trend from a peak at $89 made in 2015.
AMAG's 12-month performance chart shows the stock down 50% versus a 10% gain for the stock market.
Strategy Opinion: TTD is targeting AMAG for a decline to 8 within the next few months, or sooner. A protective stop buy can be placed near 11.
Suitability: Aggressive Bears.
TTD's probability research of Prior Performance:
Probability - Earnings Response - Slightly Bearish. - AMAG rose 4 times after the past 9 earnings reports when there was a significant change in price.
Probability: Seasonal Activity - Slightly Bearish. - AMAG averaged a gain of 0.1% in May but a decline of 0.8% in June the past several years.
|
TTD's Quality Rating of Stock - AMAG - BELOW AVERAGE |
Stock's Performance Chart with Quarterly Earnings Markers vs. S&P 500
Insider Buying in Green - Insider Selling in Red

TTD columnist Leo Fasciocco has covered the stock market for over 30 years. His articles appear in many publications. He has also been a speaker at the Money Show conferences. He has been on television and radio. He is author of many educational articles about stock investing and the book ōGuide To High-Performance Investing.ö

For information to subscribe to the Ticker Tape Digest Services call: Beverly Owen at 1-480-878-8381 or 480-704-3331
Distributed by Corona Publishing Enterprises. TickerTape Digest Inc. 1220 W. Sherri, Gilbert, Az. 85233.
TTD ōProfessional Reportö is available on the Web: $100 per month. Password needed. Published daily - around 20 times a month.
TTD Pro Report includes a Morning chart slide show of breakout stocks, a Midsession video-audio show with commentary on breakout stocks and shorts and a Final end of day overall report on breakout stocks for the session, short plays and accumulation plays. There are other features too such as Quick Trades and Long-term Plays.
TTD Daily Report is $39. It covers a Morning slide show of charts of stocks breaking out and a TTD end of day print report covering breakout stocks and shorts.
Credit cards accepted. Payable to Corona Publishing Enterprises.
(The information contained has been prepared from data deemed reliable but there is no guarantee of complete accuracy. Ticker Tape Digest Inc. is not affiliated with any broker, dealer or investment advisor. Nothing in this publication constitutes an offer, recommendation or solicitation to buy or sell any securities. Further research is advised. This report is copyrighted and no redistribution is permitted with out permission.)