![]()
Daily - Bullish Investors - Go To TTD Pre-Market Opening Breakout Watch List - Tuesday, May 8, 2018
|
|
Daily - Bullish Investors - Go To TTD Pre-Market Opening Breakout Watch List - Tuesday, May 8, 2018 |
|
Weekly - Bullish Conservative Investors - Go To TTD Long-Term Plays - Monday, May 7, 2018 |
|
|
Go to Video Show - "How to Make Money With Breakout Stocks |
|---|

By Leo Fasciocco -- TTD
Ticker Tape Digest presents its daily stock market report containing stocks to go long as Breakout Trades, Quick Trades, or Bargain Accumulation Trades.
We also feature stocks under Significant Accumulation that are poised to breakout.
|
Ticker Tape Digest's Daily schedule guide for TTD subscribers 1. Pre-market - check Breakout Watch List and Quick Trades. 2. Morning - (11:30 - 12 A.M.) - check breakout stocks tape and breakout chart slide show. 3. Midday (1 P.M.) check TTD Midsession Report and see market video show. 4. After close (4 P.M.) check final TTD Report for day. Trading Strategies Bullish Aggressive Investors Bullish - "Breakout Stocks" - ideally suited for bull markets and special situation stocks. Potential for large returns. (See Performance) Aggressive Investor Bullish- "Quick Trade Stocks" -ideally suited for entry into top performing issues looking for a small quick profit." (See Performance) Conservative Investors "Bargain Buy Trades for the Long Term." Ideally suited for entry into top performing big cap stocks on pullbacks within overall up trend.(See Performance) Bearish Aggressive Bearish Investors - "Breakdown Stocks" to Sell Short. Ideally suited for bear markets or market pull backs. Potential for large returns (See Performance) |
|---|
The TTD report also contains stocks to short as breakdown plays and as bargain (swing trade) shorts.
Investors should tend to try to go with a strategy that fits with the stock market's trend, unless there is a special situation play.
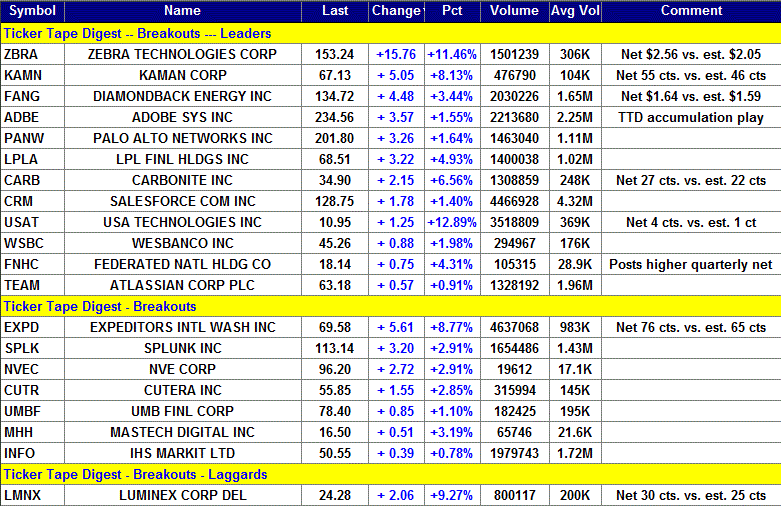
TTD's Breakout Stocks - Long are
most suitable for aggressive investors seeking ideal entry points into leading stocks, especially during bull markets. They can do extremely well in bull markets with gains of as much as several hundred percent. 
These stocks can also do extremely well during strong market rallies, or if they are in a industry group that is performing very well. They tend to have strong earnings outlooks and are near new-52 week, or all-time highs.
TTD Quick Trade Stocks - Long These are leading issues that have pulled back in recent days, but could move higher soon. They are most suitable for Aggressive Investors willing to trade short term. These stocks will do extremely well during market advances. They have about 74% win rate. During market rally sequences the win rate is even higher. The return is small 3% to 8% in just a few days.
TTD's Bargain Buy Trades - Long - Long Term. These are for conservative bullish Investors These long-term buys are ideally suited for entry into stocks on pull backs within overall up trend. These stocks can give a good return long-term especially during a bull market.
TTD also presents Stocks To Sell or Sell Short. These issues are suitable for aggressive investors willing to take short positions both as trades or for longer-term plays. These stocks will do very well during bear markets or market pull backs.
TTD's Bearish breakdown stocks to sell short. These issues have potential to fall sharply. They often show a technical breakdown and also some fundamental business problem such as weak earnings.
TTD's multi-media updates include a slide-show that presents charts and analysis at midsession. Some times TTD presents feature analysis on stocks and the market. TTD uses Windows Media Files. (WMV).
TTD also presents a "Breakout Watch List" that is up dated daily. This list consists of key stocks in position to breakout. A close watch of this list can put you in the stock just as it breaks out. A good idea is to study the list and be ready to move into a stock quickly as it hits its breakpoint.
TTD often suggests using stop buy orders to enter. It is very important to buy a breakout stock as close as possible to the breakpoint. The idea is to get "elbow room" if the stock should follow through to the upside. This is very important in being successful in making big money with breakout stocks.
It is also essential to have a stop loss strategy for all stocks in which positions are taken. Not every stock will work as expected. It is important for investors to "police" their portfolios and avoid getting trapped in any bad positions.
Quality rating of breakout Two key factors: 1 - Stock near all-time high in price or near a 52-week high. 2 - earnings growth current year is strong. The ideal play is a stock with an Above Average Quality Rating. The stock is near a new high and will have strong earnings. TTD's other ratings are Average and Below Average.
TTD also has special feature sections on Educational Tips on Investing.
To email Mr. Leo Fasciocco leo@tickertapedigest.com.
For service, email Beverly Owen owen@tickertapedigest.com. TTD’s Tel: 1-480-926-1680.
Tuesday - May 8, 2018
TTD's Breakout Stocks
Stock Market Overview
Total Buy Breakouts so far today - 20
Quality of Breakouts - Above Average.
Stocks Screened - 12,234
Bull side - Large list of breakouts with some good looking plays. Aggressive Bulls can be venturesome.
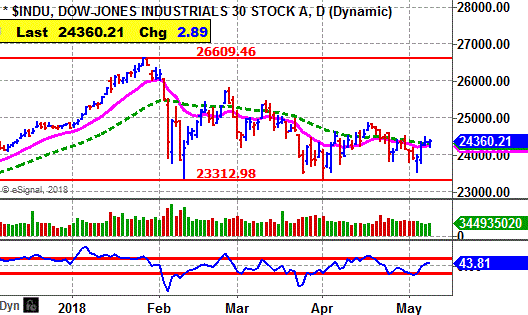
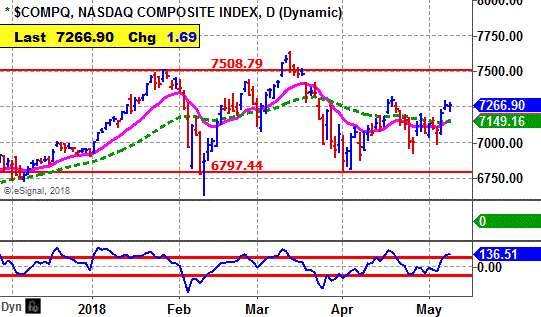
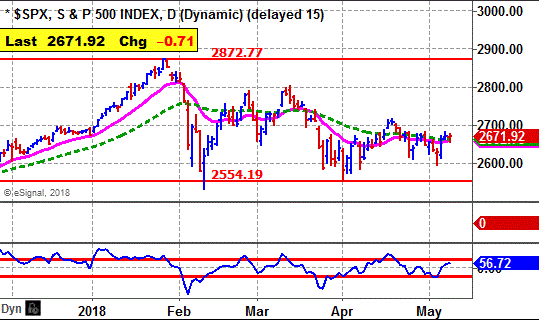
Stock market - Major averages bullish on daily. The weekly averages are mixed. Stock market is locked in a trading range.
Stock Market Momentum
(Daily is based on a moving average)
|
Market (Daily) |
Market (Weekly) |
Market (Monthly) |
|
Dow - Bullish |
Dow - Bearish |
Dow - Bullish, |
|
Nasdaq - Bullish |
Nasdaq - Bullish |
Nasdaq - Bullish |
|
S&P 500 - Bullish |
S&P 500 - Neutral |
S&P 500 - Bullish |
Ticker Tape Digest's
|
TTD's Quality Rating of Stock - ADBE - ABOVE AVERAGE |
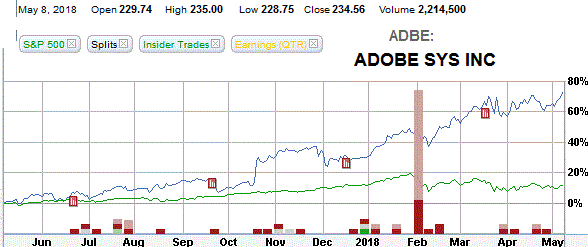
ADBE, based in San Jose, Ca., provides imaging software for the web and print. Annual revenues: $7.3 billion. ADBE's stock, a leader, moves higher Tuesday and breaks out from its nine-week flat base. The stock is a leader. The move carries the stock to a new all-time high. 
So far today, ADBE is trading 2.2 million shares. Its average daily volume is 2.3 million shares.
ADBE's stock declined slightly in the morning. However, it turned and rallied steadily crossing its breakpoint line in the morning. 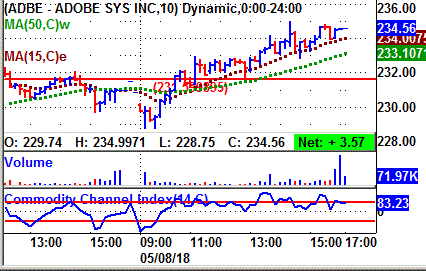
The stock finished near its high for the day with good intraday volume.
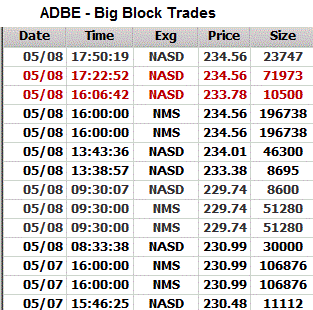
Tape Action
ADBE's tape action shows the recent block trades.
One can see the price for the blocks climbing from $229.74 in the morning to as high as $234.56 in the afternoon.
A key bullish trade came late on Monday when a block of 106,876 shares (duplicated) crossed the tape at $230.99.
That was up from the prior block trade at $230.48 on 11,112 shares.
Near the close Tuesday a block of 196,738 shares (duplicated) crossed at $234.56. That was up from the prior block at $234.01 on 46,300 shares.
Business
ADBE provides graphic design, publishing, and imaging software for Web and print.
It offers a line of application software products for producing, distributing, and managing information.
The company license its industry-standard technologies to major hardware manufacturers, software developers, and service providers.
Charts
There was steady insider selling this year. The latest was in the past two months at $184 to $231.
Some insiders were buyers earlier this year at $33 to $34 using stock options.
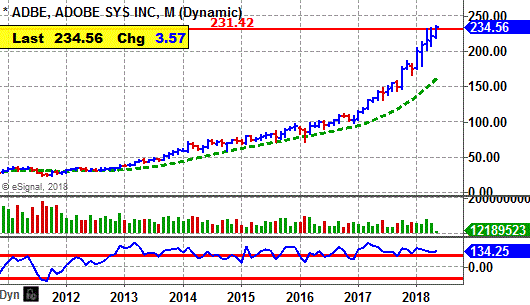
ADBE reached a peak of $48 in 2007, the top in the prior bull market. The stock then fell back to $15.70 by early 2009 due to the following bear market.
ADBE then trend in a trading range until 2013. It broke out and has since trended steadily higher.
The stock came public back in 1986. It has gone through six 2-for-1 stock splits. ADBE push to a new all-time high is bullish..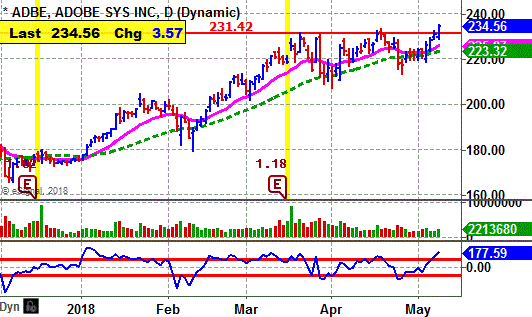
ADBE's daily chart shows the stock climbing from $165.75 in December to a peak near $230 by March.
The stock then pulled back and formed a base. It broke out in April, but faded back.
It resumed its basing work and Tuesday finally broke out.
The CCI momentum indicator is strongly bullish.
Earnings Outlook
Analysts expect net for the fiscal year ending in November of 2018 to surge 48% to $6.39 a share from $4.31 a year ago.
Analysts have been raising their estimates.
The stock has a price-earnings ratio of 36. That is high. So, the stock is best for an aggressive bull.
Looking ahead to fiscal 2019 ending in November, the Street is forecasting a 13% increase in profits to $7.20 a share from the anticipated $6.39 this fiscal year. That estimate could easily be raised.
Earnings for the upcoming fiscal second quarter ending in May should surge 51% to $1.54 a share from the $1.02 the year before.
The highest estimate is at $1.60 a share. ADBE has topped the consensus estimate the past 16 quarters. That is impressive.
Going out to the fiscal third quarter ending in August net should surge 45% to $1.59 a share from the $1.10 the year before.
Strategy Opinion: TTD is targeting ADBE for a move to $285. A protective stop can be placed near $224.
TTD rates ADBE a good intermediate-term play. The stock is a leader.
Suitability: Aggressive Bulls.
TTD's special research of Stock's Prior Performance:
Probability - Breakout Success - Modestly Bullish. ADBE scored just modest gains off its recent breakout. However, the stock remains in a long-term up trend.
Probability - Earnings Response - Extremely Bullish. ADBE has moved higher 8 times after its past 9 earnings reports when there was a significant move. That is impressive.
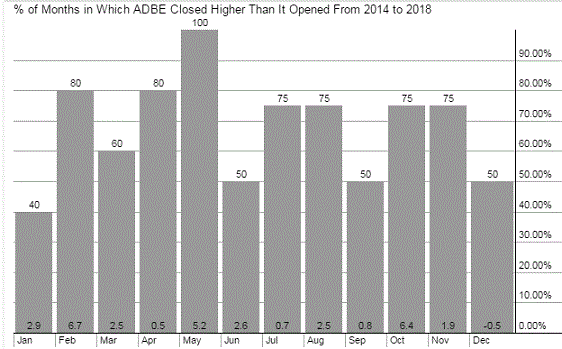
Probability: Seasonal Success - Very Bullish. ADBE has risen an average of 5.2% in May and a big 2.6% in June.
Stock's Prior Performance After A Breakout
|
Stock's % Change from Breakout to peak - prior to cut below 50-day M/A. |
Date of Breakout |
Break point Price |
Stocks Price Peak after Breakout - prior to cut below 50-day M/A |
Date Trade Closed |
|
12% |
2/23/2018 | 209.74 | 234.56 | Still in play |
|
6% |
1/11/2018 | 188.92 | 200.09 | 1/23/2018 |
|
12% |
10/19/2017 | 165.50 | 185.40 | 11/28/2017 |
|
3% |
8/22/1017 | 152.25 | 156.87 | 9/11/2017 |
|
38% |
1/20/2017 | 109.75 | 143.59 | 6/5/2017 |
|
4% |
8/10/2016 | 99.02 | 103.57 | 9/2/2016 |
|
2% |
5/24/2016 | 97.43 | 100.04 | 6/1/2016 |
| 8% | 10/15/2015 | 86.37 | 94.02 | 12/15/2015 |
| 8% | 6/22/2015 | 80.13 | 86.77 | 8/17/2015 |
| 12% | 2/11/2014 | 61.96 | 69.92 | 2/27/2014 |
(In actual trading, entry and exit points could vary depending on broker execution.
Also, ideal are breakouts to a new 52-week high or better, perhaps all-time highs.)
Stock's Long-term Chart
Stock's Performance Chart with Quarterly Earnings Markers vs. S&P 500
Insider Buying in Green - Insider Selling in Red
Stock's Monthly Seasonal Performance Chart - Past 5 Years
Showing % Months UP and % Change
| TTD's Breakout Profile Rating Adobe Systems Inc. (ADBE) |
| TTD Check List | Bullish | Bearish | Neutral |
| Near 52-week High | YES | ||
| Volume | YES | ||
| Tick Volume | YES | ||
| Price Trend - Daily | YES | ||
| Price Trend - Long Term | YES | ||
| Price Daily Spread | YES | ||
| Base Structure | YES | ||
| Base - A-D | YES | ||
| Earnings-Quarterly | YES | ||
| Earnings-Long Term | YES | ||
| Earnings Outlook | YES | ||
| Industry Group | YES | ||
| Prior Breakout Success | YES | ||
| Fund Sponsorship | YES | ||
| Total Score | 14 | 0 | 0 |
Charts of Selected Breakout Stocks
|
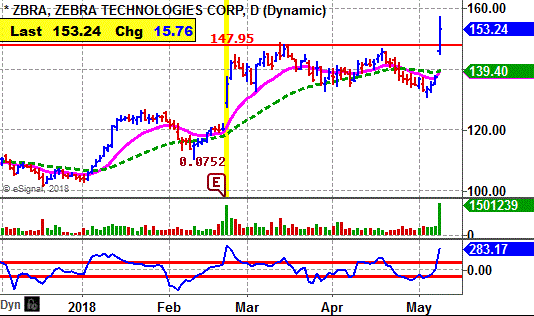
TTD's Quality Rating of Stock - ZBRA - ABOVE AVERAGE |
|
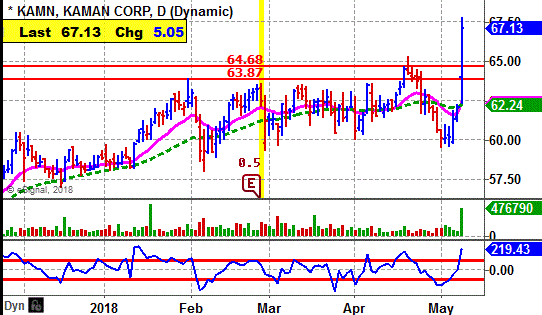
TTD's Quality Rating of Stock - KAMN - ABOVE AVERAGE |
|
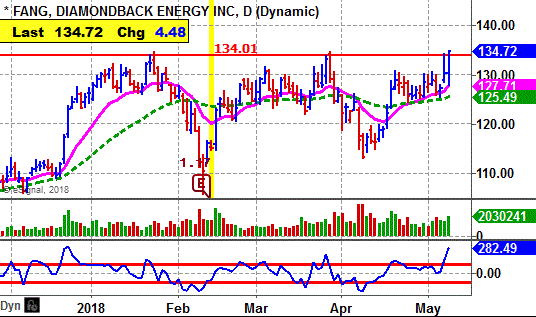
TTD's Quality Rating of Stock - FANG - ABOVE AVERAGE |
|
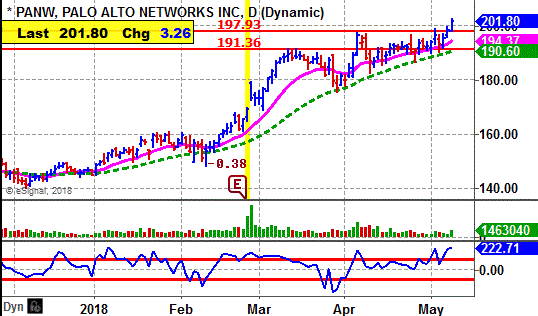
TTD's Quality Rating of Stock - PANW - ABOVE AVERAGE |

Ticker Tape Digest’s Daily List of “Stocks To Sell or Sell Short” ranks stocks well timed to be sold immediately based on daily trading. The list can be used as an alert to reduce current long-term positions.
Shorts from tape action so far today - 15
Stocks Screened - 12,234
Long-Term Environment for bears: Neutral.
Bear Side - Large list of breakdown stocks with many issues hurt by disappointing results. Bears can be venturesome.
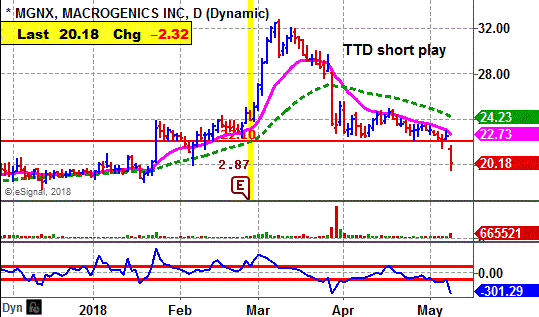
MGNX, based in Rockwell, Md., is a biotech firm working on treatments for cancer. Annual revenues: $158 million. MGNX's stock falls sharply Tuesday after reporting a wider loss. TTD sees more on the downside. 
So far today, MGNX is trading 665,521 shares, more than double its average daily volume of 249,000 shares.
MGNX reported a loss of $1.34 a share for the first quarter. That was much more than the Street estimate of a loss of $1.08 a share.
MHNX's stock gapped lower in the morning and cut below key technical support. 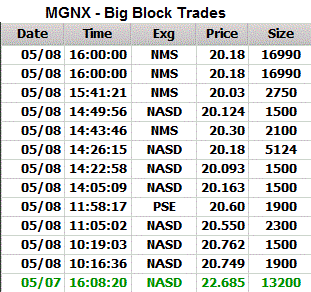
The stock touched an intraday low of $19.58 around noon. It the tried to rally but faded back and then lifted slightly in the final hour.
Tape Action
MHNX's tape action shows the recent block trades.
One can see the price for the blocks falling from $22.68 in the prior session to as low as $20.03 Tuesday afternoon.
There was some bargain hunting near the close. That is when a block of 16,990 shares (duplicated) crossed the tape at $20.18.
That was up from the prior trade in the sequence at $20.17 on 108 shares.
Business
MGRX is working on developing monoclonal antibody-based therapeutics to treat cancer and autoimmune disorders and infectious diseases.
The company develops therapeutic product candidates using its antibody-based technology platforms and also in collaboration with other biotech firms. It has a pipeline of product candidates in human clinical testing.
Earnings:
This year, analysts are forecasting a loss of $4.42 a share compared with a loss of 54 cents the year before.
For the upcoming second quarter, the Street expects a loss of $1.18 a share compared with a loss of $1.14 the year before.
Charts:
MGNX's daily chart shows the sock climbing to a peak of $32.74 in March. The stock has trended lower since then.
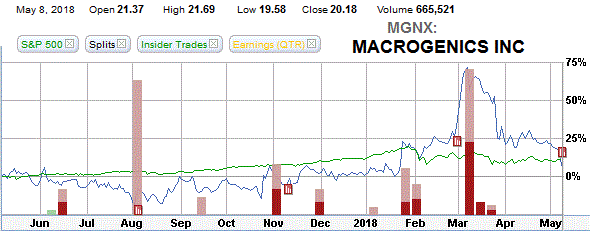
MGNX's 12-month performance chart shows the stock up 9% versus a 12% gain for the stock market. However, its performance has weakened the past two months.
Strategy Opinion: TTD is targeting MGNX for a decline to $16 within the next few months, or sooner. A protective stop buy can be placed near $21.50.
Suitability: Aggressive Bears.
TTD's special probability research of Prior Performance:
Probability - Earnings Response - Extremely Bearish. MGNX rose just 3 times after the past 9 earnings reports when there was a significant change.
Probability: Seasonal Activity - Bullish. MGNX rose an average of 0.1% in May and 9.5% in June the past several years.
|
TTD's Quality Rating of Stock - MGNX - BELOW AVERAGE |
Stock Performance Chart with Quarterly Earnings Markers vs. S&P 500
Insider Buying in Green - Insider Selling in Red
TTD columnist Leo Fasciocco has covered the stock market for over 30 years. His articles appear in many publications. He has also been a speaker at the Money Show conferences. He has been on television and radio. He is author of many educational articles about stock investing and the book “Guide To High-Performance Investing.”

For information to subscribe to the Ticker Tape Digest Services call: Beverly Owen at 1-480-926-1680.
Distributed by Corona Publishing Enterprises. TickerTape Digest Inc. 1220 W. Sherri, Gilbert, Az. 85233.
TTD “Professional Report” is available on the Web: $100 per month. Password needed. Published daily - around 20 times a month.
TTD Pro Report includes a Morning chart slide show of breakout stocks, a Midsession video-audio show with commentary on breakout stocks and shorts and a Final end of day overall report on breakout stocks for the session, short plays and accumulation plays. There are other features too such as Quick Trades and Long-term Plays.
TTD Daily Report is $39. It covers a Morning slide show of charts of stocks breaking out and a TTD end of day print report covering breakout stocks and shorts.
Credit cards accepted. Payable to Corona Publishing Enterprises.
(The information contained has been prepared from data deemed reliable but there is no guarantee of complete accuracy. Ticker Tape Digest Inc. is not affiliated with any broker, dealer or investment advisor. Nothing in this publication constitutes an offer, recommendation or solicitation to buy or sell any securities. Further research is advised. This report is copyrighted and no redistribution is permitted with out permission.)
