![]()
Daily - Bullish Investors - Go To TTD Pre-Market Opening Breakout Watch List - Monday - May 11, 2020
|
|
Daily - Bullish Investors - Go To TTD Pre-Market Opening Breakout Watch List - Monday - May 11, 2020 |
|
|
|
Go to Video Show - "How to Make Money With Breakout Stocks |
|---|

By Leo Fasciocco -- TTD
Ticker Tape Digest presents its daily stock market report containing stocks to go long as Breakout Trades, Quick Trades, or Bargain Accumulation Trades.
We also feature stocks under Significant Accumulation that are poised to breakout.
|
Ticker Tape Digest's Daily schedule guide for TTD subscribers 1. Pre-market - check Breakout Watch List and Quick Trades. 2. Morning - (11:30 - 12 A.M.) - check breakout stocks tape and breakout chart slide show. 3. Midday (1 P.M.) check TTD Midsession Report and see market video show. 4. After close (4 P.M.) check final TTD Report for day. Trading Strategies Bullish Aggressive Investors Bullish - "Breakout Stocks" - ideally suited for bull markets and special situation stocks. Potential for large returns. (See Performance) Aggressive Investor Bullish- "Quick Trade Stocks" -ideally suited for entry into top performing issues looking for a small quick profit." (See Performance) Conservative Investors "Bargain Buy Trades for the Long Term." Ideally suited for entry into top performing big cap stocks on pullbacks within overall up trend.(See Performance) Bearish Aggressive Bearish Investors - "Breakdown Stocks" to Sell Short. Ideally suited for bear markets or market pull backs. Potential for large returns (See Performance) |
|---|
The TTD report also contains stocks to short as breakdown plays and as bargain (swing trade) shorts.
Investors should tend to try to go with a strategy that fits with the stock market's trend, unless there is a special situation play.
TTD's Breakout Stocks - Long are
most suitable for aggressive investors seeking ideal entry points into leading stocks, especially during bull markets. They can do extremely well in bull markets with gains of as much as several hundred percent. 
These stocks can also do extremely well during strong market rallies, or if they are in a industry group that is performing very well. They tend to have strong earnings outlooks and are near new-52 week, or all-time highs.
TTD Quick Trade Stocks - Long These are leading issues that have pulled back in recent days, but could move higher soon. They are most suitable for Aggressive Investors willing to trade short term. These stocks will do extremely well during market advances. They have about 74% win rate. During market rally sequences the win rate is even higher. The return is small 3% to 8% in just a few days.
TTD's Bargain Buy Trades - Long - Long Term. These are for conservative bullish Investors These long-term buys are ideally suited for entry into stocks on pull backs within overall up trend. These stocks can give a good return long-term especially during a bull market.
TTD also presents Stocks To Sell or Sell Short. These issues are suitable for aggressive investors willing to take short positions both as trades or for longer-term plays. These stocks will do very well during bear markets or market pull backs.
TTD's Bearish breakdown stocks to sell short. These issues have potential to fall sharply. They often show a technical breakdown and also some fundamental business problem such as weak earnings.
TTD's multi-media updates include a slide-show that presents charts and analysis at midsession. Some times TTD presents feature analysis on stocks and the market. TTD uses Windows Media Files. (WMV).
TTD also presents a "Breakout Watch List" that is up dated daily. This list consists of key stocks in position to breakout. A close watch of this list can put you in the stock just as it breaks out. A good idea is to study the list and be ready to move into a stock quickly as it hits its breakpoint.
TTD often suggests using stop buy orders to enter. It is very important to buy a breakout stock as close as possible to the breakpoint. The idea is to get "elbow room" if the stock should follow through to the upside. This is very important in being successful in making big money with breakout stocks.
It is also essential to have a stop loss strategy for all stocks in which positions are taken. Not every stock will work as expected. It is important for investors to "police" their portfolios and avoid getting trapped in any bad positions.
Quality rating of breakout Two key factors: 1 - Stock near all-time high in price or near a 52-week high. 2 - earnings growth current year is strong. The ideal play is a stock with an Above Average Quality Rating. The stock is near a new high and will have strong earnings. TTD's other ratings are Average and Below Average.
TTD also has special feature sections on Educational Tips on Investing.
To email Mr. Leo Fasciocco leo@tickertapedigest.com.
For service, email Beverly Owen owen@tickertapedigest.com. TTDÆs Tel: 1-480-878-8381 or 480-704-3331.
Monday - May 11, 2020
TTD's Breakout Stocks
Stock Market Overview
Total Buy Breakouts - 10
Quality of Breakouts - Average.
Stocks Screened - 12,234
Bull side - Large list of breakouts, but very selective. Bulls be conservative.
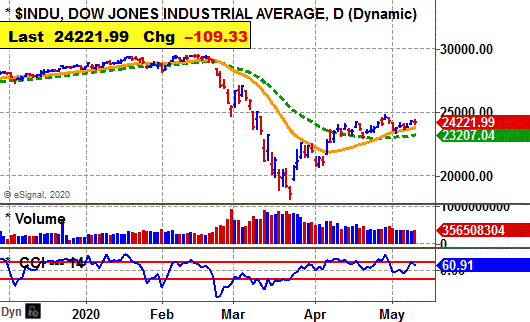
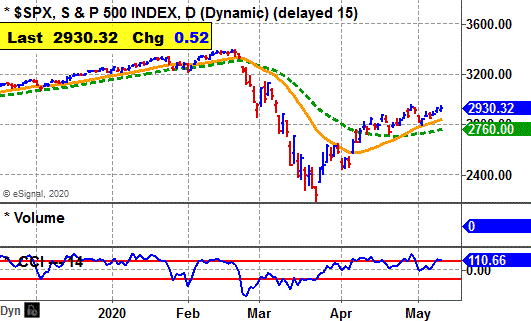
Stock market - Major averages bullish on a daily basis. However, the weekly Dow and S&P and monthly Dow remain bearish.
Comment - Stock market poised for a possible push higher to its all-time peak. However, the Dow does lag.
See Latest Earnings Reports - A company that tops the Street's highest earnings estimate has potential to go higher. Key earnings beats - AMRX, AKRX, ASRT, IIVI and MESA.
Stock Market Momentum
(Daily is based on a moving average)
|
Market (Daily) |
Market (Weekly) |
Market (Monthly) |
|
Dow - Bullish |
Dow - Bearish |
Dow - Bearish |
|
Nasdaq - Bullish |
Nasdaq - Bullish |
Nasdaq - Bullish |
|
S&P 500 - Bullish |
S&P 500 - Bearish |
S&P 500 - Bullish |

 Ticker Tape Digest's
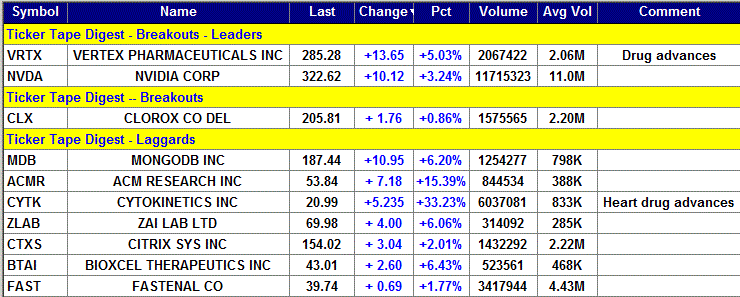
|
TTD's Quality Rating of Stock - NVDA - ABOVE AVERAGE |
NVDA, based in Santa Clara, Ca., produces products for personal computer graphics, graphics processing unit and also on artificial intelligence. Annual revenues: $10.9 billion. NVDA's stock breaks out Monday from a 13-week, cup-and-handle base. 
The move carries the stock to a new all-time high. That is bullish.
TTD sees more on the upside. TTD highlighted NVDA as a breakout at our midsession video show on the Web Monday.
So far today, NVDA is trading 11.7 million shares. Its average daily volume is 11 million shares.
The stock was recent promoted by a few brokerage firms.
NVDA's stock drove higher in the morning and cleared its breakpoint line. 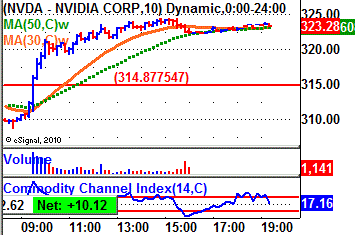
The stock reached an intraday high of $324.50 in the afternoon. The stock then trended sideways the rest of the day.
In after-hours trading, NVDA was up 0.88.
Tape Action
NVDA's tape action shows the recent block trades.
One can see the price for the blocks climbing from $312 in the morning to as high as $323 by the afternoon.
A key bullish trade came in the morning when a block of 25,990 shares crossed the tape at $314.
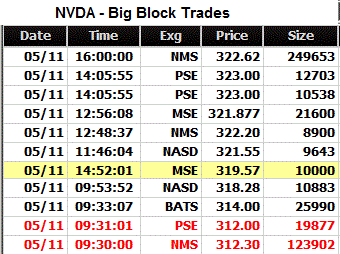 That was up from the prior block at $312 on 19,877 shares.
Business
NVDA computer products are aimed at specialized markets such as GeForce for gamers, Quadro for designers, Tesla and DGX for AI data scientists and big data researchers.
Its Tegra brand integrates an entire computer onto a single chip, and incorporates GPUs and multi-core central processing units to drive supercomputing for mobile gaming and entertainment.
It is also used as autonomous robots, drones and for cars.
Charts
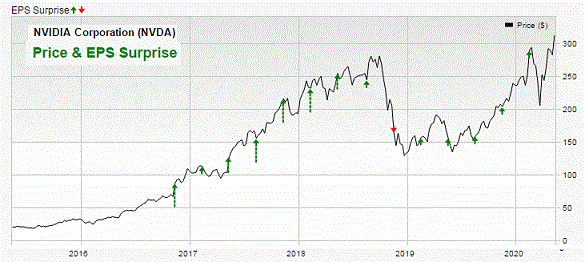
NVDA's 12-month performance chart shows the stock up 102% versus a 3% gain for the stock market.
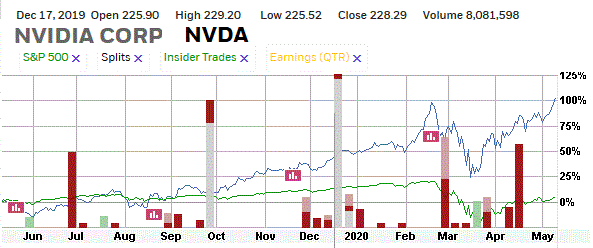
Insiders were recent buyers using stock options at $14 a share. They were NVDA directors.
They were sellers at $220 to $271 a share.
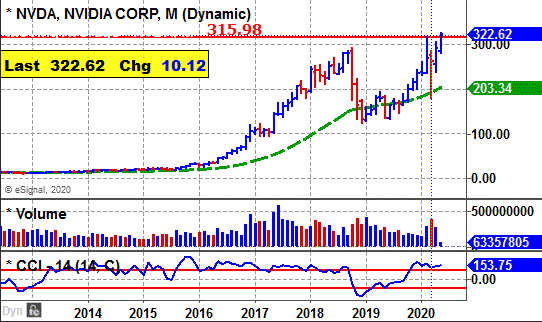
NVDA's long-term chart shows the stock climbing from $24 back in 2015 to a peak at $292 by October of 2018.
The stock then fell back to $124 late in 2018. However, since then NVDA has been trending steadily higher. 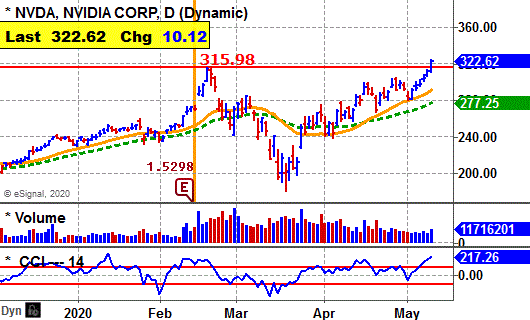
NVDA's daily chart shows the stock climbing from $200 back in December to a peak at $315 by February.
The stock formed a reverse head-and-shoulder pattern.
The breakout clears upside resistance with a pick up in volume.
NVDA's CCI momentum indicator is strongly bullish.
Earnings Outlook
For the fiscal year ending in January of 2021, analysts are forecasting a 20% increase in net to $7.45 a share from the $5.79 the year before.
The stock sells with a price-earnings ratio of 43. That is high.
Looking out to fiscal 2022 ending in January, the Street predicts a 20% increase in net to $8.92 a share from the anticipated $7.45 this fiscal year.
Quarterly earnings will be very strong.
Net for the fiscal first quarter ending in April should jump 92% to $1.69 a share from the 88 cents the prior year.
12 analysts follow the stock.
Net for the fiscal second quarter ending in July should climb 48% to %1.84 a share from the $1.24 the prior year.
Strategy Opinion: TTD is targeting NVDA for a move to $375 within the next few months, or sooner.
A protective stop can be placed near $310.
Intermediate-Term Rating: Average.
Suitability: Aggressive Bulls.
TTD's special research of Stock's Prior Performance:
|
Breakout Success |
Bullish |
NVDA scored big gains off recent breakouts. |
|
Response to Net |
Bullish |
NVDA rose 9 times after 11 earnings reports. |
|
Seasonal Success |
Bullish |
NVDA avg. gain 13.6% in May, 4% in June prior years. |
|
Earnings Beats |
Bullish |
NVDA beat Street net estimate 18 times after 20 reports. |
Stock's Prior Performance After A Breakout
|
Stock's % Change from Breakout to peak - prior to cut below 50-day M/A. |
Date of Breakout |
Break point Price |
Stocks Price Peak after Breakout - prior to cut below 50-day M/A |
Date Trade Closed |
|
24% |
2/10/2020 | 252.94 | 314.70 | 2/19/2020 |
|
82% |
9/5/2019 | 172.52 | 314.70 | 2/19/2020 |
|
20% |
9/15/2017 | 180.11 | 216.14 | 11/10/2017 |
|
77% |
5/11/2017 | 122.15 | 216.14 | 11/10/2017 |
|
175% |
5/13/2016 | 37.20 | 102.26 | 2/7/2017 |
(In actual trading, entry and exit points could vary depending on broker execution.
Also, ideal are breakouts to a new 52-week high or better, perhaps all-time highs.)
Stock's Long-term Chart
Stock's Price Performance after Reporting Earnings
Stock's Performance Chart with Quarterly Earnings Markers vs. S&P 500
Insider Buying in Green - Insider Selling in Red
Charts of Selected Breakout Stocks
|
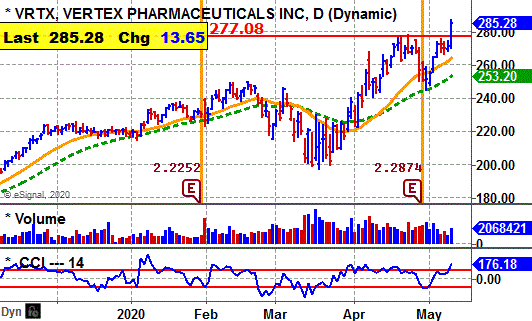
TTD's Quality Rating of Stock - VRTX - ABOVE AVERAGE |
|
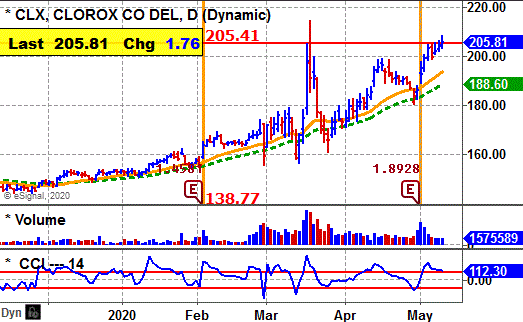
TTD's Quality Rating of Stock - CLX - AVERAGE |
|
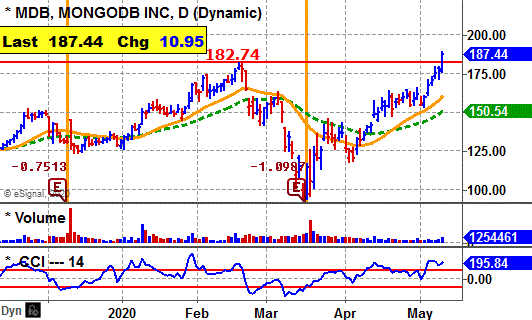
TTD's Quality Rating of Stock - MDB - BELOW AVERAGE |
|
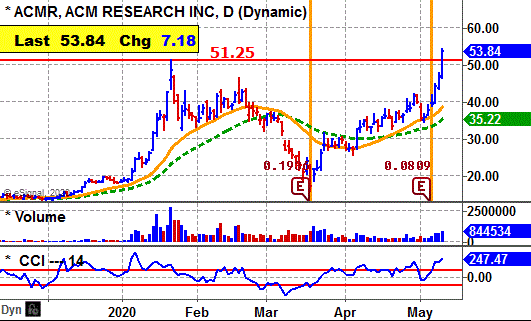
TTD's Quality Rating of Stock - ACMR - BELOW AVERAGE |

Ticker Tape DigestÆs Daily List of ōStocks To Sell or Sell Shortö ranks stocks well timed to be sold immediately based on daily trading. The list can be used as an alert to reduce current long-term positions.
Shorts from tape action - 5
Stocks Screened - 12,234
Long-Term Environment for bears: Unfavorable.
Bear Side - Small list of shorts, but some interesting plays for aggressive bears.
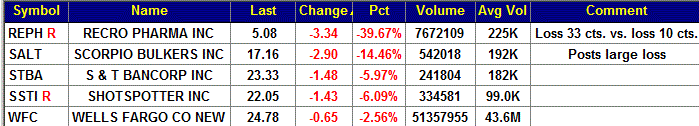
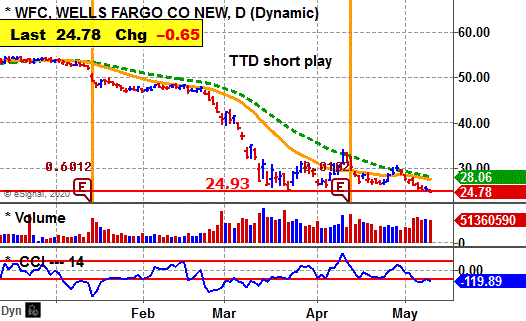
WFC, based in San Francisco, is banking firm with a variety of financial services. Annual revenues: $47 billion. WFC's stock falls sharply Monday and undercuts key technical support with a pick up in volume. ![]()
So far today, WFC is trading 51.4 million shares. Its average daily volume is 43.6 million shares.
TTD sees more on the downside. 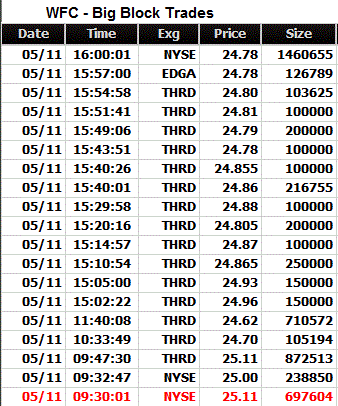
WFC's stock moved lower in the morning and undercut key support.
The stock touched an intraday low of $24.60 in the morning.
The stock staged a rally and got back above its breakpoint line around noon.
However, the stock faded again in the afternoon.
Tape Action
WFC's tape action shows the recent block trades.
One can see the price for the blocks falling from $25.11 in the morning to as low as $24.62 later in the morning.
A key bearish trade came in the morning when a block of 105,194 shares crossed the tape at $24.70.
That was down from the prior block at $25.11 on 872,513 shares.
Near the close a massive block of 1,460,655 shares crossed at $24.78. That came on down tick block sequence from $24.80 on 103,625 shares.
Business
WFC has three operating areas: Community banking, wholesale Banking, and investment management. The company offers personal, small business and commercial services.
WFC operates in the U.S and in other countries. It provides financial services via wholesale banking, mortgage banking, consumer finance, equipment leasing, agricultural finance and securities brokerage and investment banking.
Earnings:
This year,analysts forecast an 82% drop in net to 79 cents a share from the $4.38 the prior year.
Net for the second quarter should fall 79% to 27 cents a share from the $1.30 the year before.
The lowest estimate for the quarter is a loss of 58 cents a share. Nine analysts follow the stock.
Charts:
WFC's daily chart shows the stock falling from $53 earlier this year down to $25 by March. The drop was triggered in part by the slowdown in the economy. The stock tried to form a bottom, but now is breaking down.
That is bearish in that WFC has been unable to rally.
Strategy Opinion: TTD is targeting WFC for a decline to $20. A protective stop buy can be placed near $26.20.
Suitability: Aggressive Bears.
TTD's Stock Probability research of Prior Performance:
|
Response to Net |
Bearish |
WFC rose 5 times after 15 earnings reports. |
|
Seasonal Success |
Bearish |
WFC lost 3.2% in May, rose 2.7% in June prior years. |
|
Earnings Beats |
Bearish |
WFC beat Street estimate 4 times after 10 reports. |
|
TTD's Quality Rating of Stock - WFC - BELOW AVERAGE |
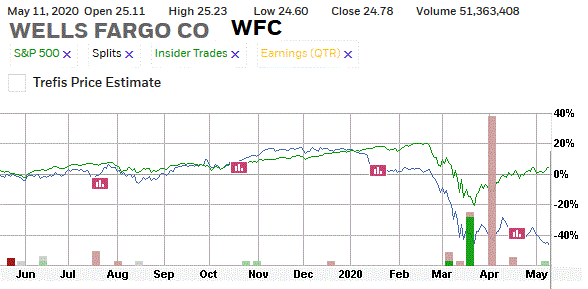
Stock's Performance Chart with Quarterly Earnings Markers vs. S&P 500
Insider Buying in Green - Insider Selling in Red
TTD columnist Leo Fasciocco has covered the stock market for over 30 years. His articles appear in many publications. He has also been a speaker at the Money Show conferences. He has been on television and radio. He is author of many educational articles about stock investing and the book ōGuide To High-Performance Investing.ö

For information to subscribe to the Ticker Tape Digest Services call: Beverly Owen at 1-480-878-8381.
Distributed by Corona Publishing Enterprises. TickerTape Digest Inc. 1220 W. Sherri, Gilbert, Az. 85233.
TTD ōProfessional Reportö is available on the Web: $100 per month. Password needed. Published daily - around 20 times a month.
TTD Pro Report includes a Morning chart slide show of breakout stocks, a Midsession video-audio show with commentary on breakout stocks and shorts and a Final end of day overall report on breakout stocks for the session, short plays and accumulation plays. There are other features too such as Quick Trades and Long-term Plays.
TTD Daily Report is $39. It covers a Morning slide show of charts of stocks breaking out and a TTD end of day print report covering breakout stocks and shorts.
Credit cards accepted. Payable to Corona Publishing Enterprises.
(The information contained has been prepared from data deemed reliable but there is no guarantee of complete accuracy. Ticker Tape Digest Inc. is not affiliated with any broker, dealer or investment advisor. Nothing in this publication constitutes an offer, recommendation or solicitation to buy or sell any securities. Further research is advised. This report is copyrighted and no redistribution is permitted with out permission.)