Daily - Go to TTD's Tape of Stock Charts - Monday, May 13, 2013
|
Daily - Go to TTD's Tape of Stock Charts - Monday, May 13, 2013 |
|
Weekly - Bullish Conservative Investors - Go To TTD Long-Term Plays - Monday, May 13, 2013 |
|
Go to Video Show - "How to Make Money With Breakout Stocks" |
|---|

By Leo Fasciocco -- TTD
Ticker Tape Digest presents its daily stock market report containing stocks to go long as breakout trades, quick trades, or bargain trades. We also feature stocks under Significant Accumulation that are poised to breakout.
|
Ticker Tape Digest's Daily schedule guide for TTD subscribers 1. Pre-market - check Breakout Watch List and Quick Trades. 2. Morning - (11:30 - 12 A.M.) - check breakout stocks tape and breakout chart slide show. 3. Midday (1 P.M.) check TTD Midsession Report and see market video show. 4. After close (4 P.M.) check final TTD Report for day. Trading Strategies Bullish Aggressive Investors Bullish - "Breakout Stocks" - ideally suited for bull markets and special situation stocks. Potential for large returns. (See Performance) Aggressive Investor Bullish- "Quick Trade Stocks" -ideally suited for entry into top performing issues looking for a small quick profit." (See Performance) Conservative Investors "Bargain Buy Trades for the Long Term." Ideally suited for entry into top performing big cap stocks on pullbacks within overall up trend.(See Performance) Bearish Aggressive Bearish Investors - "Breakdown Stocks" to Sell Short. Ideally suited for bear markets or market pull backs. Potential for large returns (See Performance) |
|---|
The TTD report also contains stocks to short as breakdown plays and as bargain (swing trade) shorts.
Investors should tend to try to go with a strategy that fits with the stock market's trend, unless there is a special situation play.
TTD's Breakout Stocks - Long are
most suitable for aggressive investors seeking ideal entry points into leading stocks, especially during bull markets. They can do extremely well in bull markets with gains of as much as several hundred percent. 
These stocks can also do extremely well during strong market rallies, or if they are in a industry group that is performing very well. They tend to have strong earnings outlooks and are near new-52 week, or all-time highs.
TTD Quick Trade Stocks - Long These are leading issues that have pulled back in recent days, but could move higher soon. They are most suitable for Aggressive Investors willing to trade short term. These stocks will do extremely well during market advances. They have about 74% win rate. During market rally sequences the win rate is even higher. The return is small 3% to 8% in just a few days.
TTD's Bargain Buy Trades - Long - Long Term. These are for conservative bullish Investors These long-term buys are ideally suited for entry into stocks on pull backs within overall up trend. These stocks can give a good return long-term especially during a bull market.
TTD also presents Stocks To Sell or Sell Short. These issues are suitable for aggressive investors willing to take short positions both as trades or for longer-term plays. These stocks will do very well during bear markets or market pull backs.
TTD's Bearish breakdown stocks to sell short. These issues have potential to fall sharply. They often show a technical breakdown and also some fundamental business problem such as weak earnings.
TTD's multi-media updates include a slide-show that presents charts and analysis at midsession. Some times TTD presents feature analysis on stocks and the market. TTD uses Windows Media Files. (WMV).
TTD also presents a "Breakout Watch List" that is up dated daily. This list consists of key stocks in position to breakout. A close watch of this list can put you in the stock just as it breaks out. A good idea is to study the list and be ready to move into a stock quickly as it hits its breakpoint.
TTD often suggests using stop buy orders to enter. It is very important to buy a breakout stock as close as possible to the breakpoint. The idea is to get "elbow room" if the stock should follow through to the upside. This is very important in being successful in making big money with breakout stocks.
It is also essential to have a stop loss strategy for all stocks in which positions are taken. Not every stock will work as expected. It is important for investors to "police" their portfolios and avoid getting trapped in any bad positions.
Quality rating of breakout Two key factors: 1 - Stock near all-time in price or near a 52-week high. 2 - earnings growth current year is strong. The ideal play is a stock with an Above Average Quality Rating. The stock is near a new high and will have strong earnings. TTD's other ratings are Average and Below Average.
TTD also has special feature sections on Educational Tips on Investing.
To email Mr. Leo Fasciocco leo@tickertapedigest.com.For service, email Beverly Owen owen@tickertapedigest.com. TTD’s Tel: 1-480-926-1680.
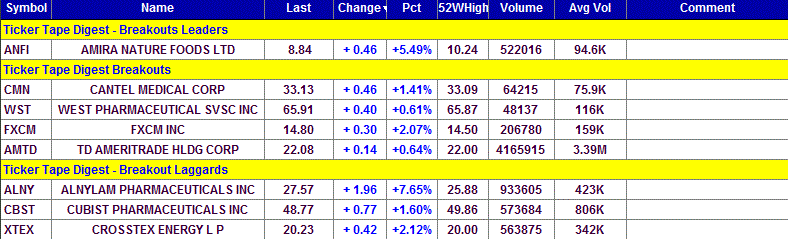
Breakout Stocks
Total Buy Breakouts so far today - 8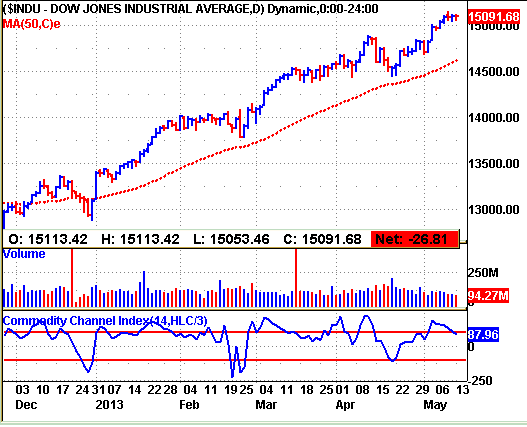
Overall Quality of Breakouts - Below Average
Stocks Screened - 8,300
Bull side - Breakout list shows some interesting plays in the brokerage area, which does well in bull markets. Bulls be selective. Stock market holds up trend.
(Put mouse on Dow chart to see Nasdaq chart)
Long Term Environment for bulls: Favorable
Market (Daily) - NYSE Bullish, Nasdaq Bullish
Market (Weekly) - NYSE Bullish, Nasdaq Bullish
Market (Monthly) - NYSE Bullish, Nasdaq Bullish
Ticker Tape Digest's
|
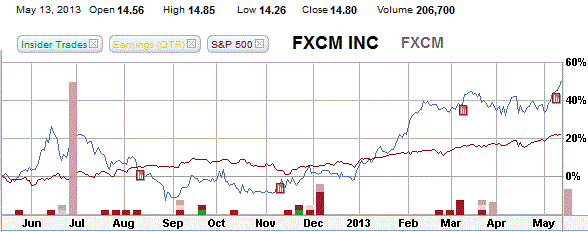
TTD's Quality Rating of Stock - FXCM - AVERAGE |
FXCM, based in New York, is an online provider of foreign exchange, trading and related
services to retail and institutions globally. Annual revenues: $417 million. FXCM's stock breaks out today from a 10-week flat base. The move carries the stock to a 52-week high. 
So far today, FXCM is trading 206,780 shares. Its average daily volume is 159,000 shares. 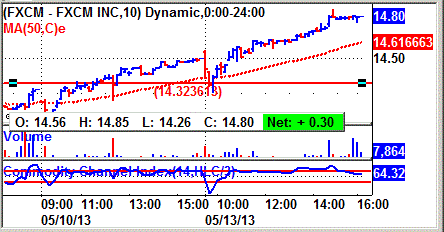
FXCM's stock slipped slightly in the morning. (see 10-minute chart). The stock then turned and rallied steadily during the session.
It closed near its high for the day with a good pick up in volume.
FXCM's tape action shows the recent big block trades.
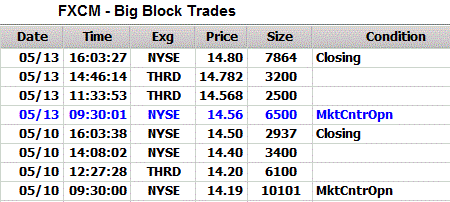 One can see the price for the blocks climbing from $14.19 to as high as $14.80.
A key bullish trade came in the morning when a block of 6,500 shares crossed the tape at $14.56. That was up from the prior block at $14.50.
Then late in the session a block of 7,864 shares crossed at $14.80, up from the prior block at $14.78
FXCM offers customers access to over-the-counter, FX markets through its proprietary technology platform.
Its platform presents its FX customers with the price quotations on currency pairs from global banks, financial institutions and market makers.
The Company acts as a credit intermediary, simultaneously entering into offsetting trades with both the customer and the FX market maker.
It earns trading fees and commissions by adding a markup to the price provided by the FX market makers and generate its trading revenues based on the volume of transactions, not trading profits or losses.
The business of the company is operated through two segments, retail trading and institutional trading. The institutional trading offers FX trading services to banks, hedge funds and other institutions on an agency model basis.
FXCM's 12-month performance chart shows the stock appreciating 50% versus a 20% gain for the S&P 500 index.
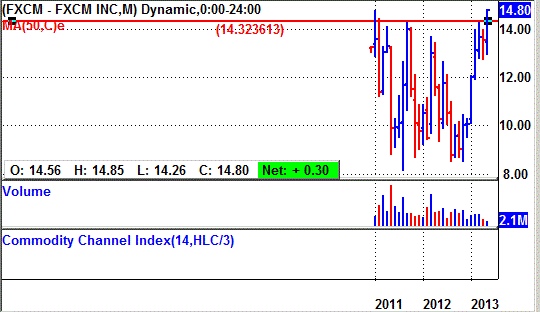
FXCM's long-term chart shows the stock coming public in late 2010 and trading around 15. The stock declined to as low as 8 by mid 2011. It then traded in a volatile way for the next several months. However earlier this year, the stock drove sharply higher, based and then broke out again.
FXCM is in position to possibly make a new all-time high. It needs to get over 15.34. 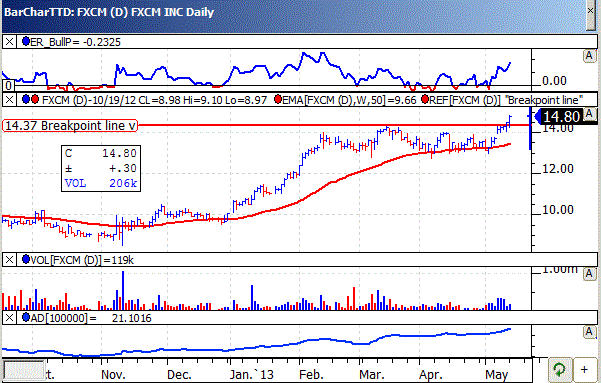
FXCM's daily chart shows the stock climbing from 8 back in November to a peak around 14.
The stock then put down a well-formed flat base, mostly above the 50-day moving average line.
The breakout today looks solid.
The TTD momentum indicator (top of chart) is strongly bullish.
The accumulation - distribution line (bottom of chart) is in a strong up trend and compliments the price of the stock.
This year, analysts are forecasting a 65% surge in profits to 88 cents a share from 53 cents a year ago. The stock sells with a price-earnings ratio of 16. TTD sees that as low given the earnings growth rate. So, the stock is a good value-growth play.
Looking ahead to 2014, profits are projected to climb 29% to $1.13 a share from the anticipated 88 cents a share this year.
Net for the upcoming second quarter should soar 93% to 21 cents a share from 11 cents a year ago. The company is benefiting from increased trading volume. However, its institutional trading tailed off. The company does get the bulk of its business from individuals. 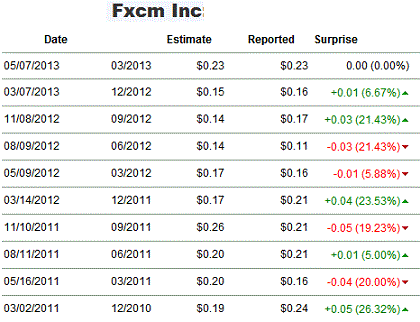
For the third quarter, analysts look for a 31% gain in net to 22 cents a share from 17 cents a year ago.
Strategy Opinion: FXCM's strong earnings outlook should help to drive the stock. TTD is targeting FXCM for a move to 18.50 within the next few months, or sooner.
A protective stop can be placed near 13.70. TTD rates FXCM a very good intermediate-term play provided earnings remain on course.
Sponsorship: Average. The largest fund holder is the 2-star rated Fidelity Growth Strategies Fund with a 1.8% stake. It has held its position steady.
A key buyer recently was Schwab Small-Cap Equity Fund, 3-star rated, which purchased 43,500 shares.
FXCM has 37 million shares outstanding. Institutions hold 67% of the stock.
Insider Activity: Bearish. Insiders have been sellers recently around $14.30. Currently, 5 analysts follow the stock and all 5 have a buy, down from 6 three months ago.
Stock Performance Chart with Quarterly Earnings Markers.
| TTD's Breakout Profile
Rating FXCM Inc. - (FXCM) |
| TTD Check List | Bullish | Bearish | Neutral |
| Near 52-week High | YES | ||
| Volume | YES | ||
| Tick Volume | YES | ||
| Price Trend - Daily | YES | ||
| Price Trend - Long Term | YES | ||
| Price Daily Spread | YES | ||
| Base Structure | YES | ||
| Base - A-D | YES | ||
| Earnings-Quarterly | YES | ||
| Earnings-Long Term | YES | ||
| Earnings Outlook | YES | ||
| Industry Group | YES | ||
| Prior Breakout Success | YES | ||
| Fund Sponsorship | YES | ||
| Total Score | 10 | 0 | 4 |
Charts of Selected Breakout Stocks
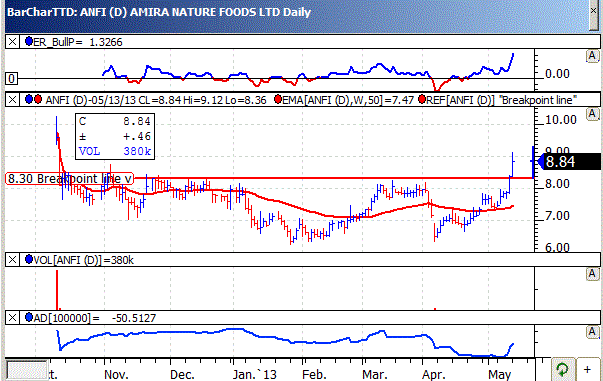
| TTD's Quality Rating of Stock - ANFI - ABOVE AVERAGE |
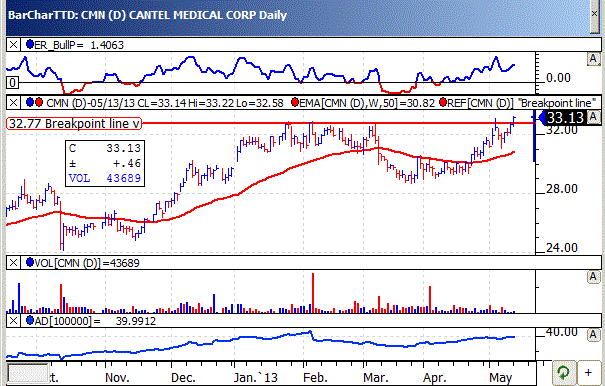
| TTD's Quality Rating of Stock - CMN - AVERAGE |
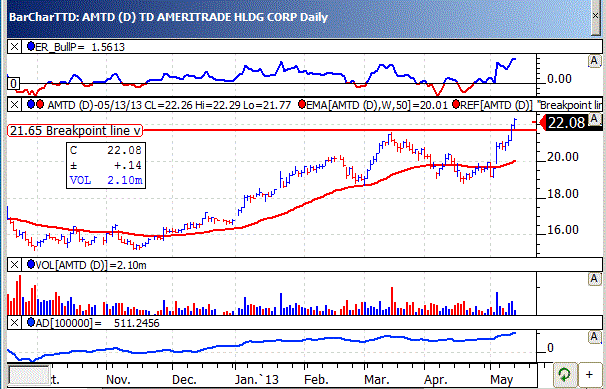
| TTD's Quality Rating of Stock - AMTD - AVERAGE |

Ticker Tape Digest’s Daily List of “Stocks To Sell or Sell Short” ranks stocks well timed to be sold immediately based on daily trading. The list can be used as an alert to reduce current long-term positions.
Shorts from tape action so far today - 2
Stocks Screened - 8,300
Long-Term Environment for bears: Unfavorable.
Bear Side - Only a small list of breakdown stocks today. Bears be conservative and selective. Stock market remains in up trend.
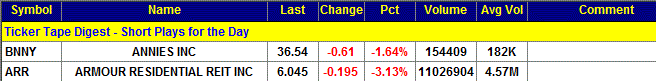
BNNY, based in Berkely, Ca., produces packaged natural and organic foods. Annual revenues: $159 million. BNNY's stock, a recent new issue, slips below key technical support. TTD sees more on the downside. So far today, BNNY's stock is trading 193,378 shares. Its average daily volume is 182,000 shares. 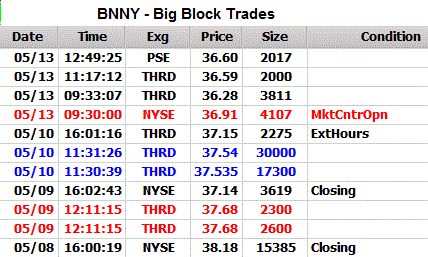
TTD highlighted BNNY as a short at our midsession video show on the Web.
BNNY's stock fell sharply in the morning. It hit an intraday low of 36.26 and fell below near-term support. The stock then lifted slightly and trended sideways the rest of the session.
BNNY's tape action shows the recent block trades.
One can see the price for the blocks the past few sessions declining from $38.18 to as low as $36.28.
A key bearish trade came when a block of 4,107 shares crossed Monday at $36.91. That was down from the prior block at $37.15.
The company's product lines include macaroni and cheese, snack crackers, fruit snacks and graham crackers.
BNNY's markets and sells its product through grocery stores, mass merchandiser and natural retailer. It sells products in three primary product categories: meals, snacks, and dressings.
For the fiscal year ending in March of 2013, analysts look for a 7% rise in net to 79 cents a share from 74 cents a year ago.
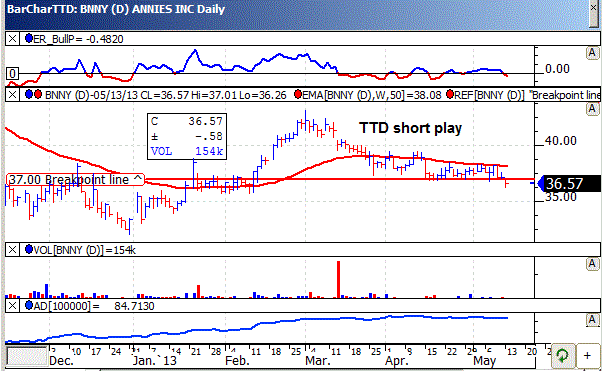
BNNY's daily chart shows the stock sliding below key support. The TTD momentum indicator (top of chart) has now turned bearish.
Strategy Opinion: TTD sees BNNY as a trading short. We are targeting the stock for a decline to 32 within the next few weeks or sooner. A protective stop buy can be placed near 38.
| TTD's Quality Rating of Stock - BNNY - BELOW AVERAGE |
TTD columnist Leo Fasciocco has covered the stock market for over 20 years. His articles appear in many publications. He is also a speaker at the Intershow conferences. He has been on television and radio. He is author of many educational articles about stock investing and the book “Guide To High-Performance Investing.”

For information to subscribe to the Ticker Tape Digest Services call: B. J. Owen at 1-480-926-1680. Distributed by Corona Publishing Enterprises. Ticker Tape Digest Inc. P.O. Box 2044 Chandler, Az. 85244-2044. TTD “Professional Report” is available on the World Wide Web: $100 per month. Password needed. “TTD Professional“ Faxed is $200 per month. The TTD Daily Report is $39.95. Credit cards accepted.
(The information contained has been prepared from data deemed reliable but there is no guarantee of complete accuracy. Ticker Tape Digest Inc. is not affiliated with any broker, dealer or investment advisor. Nothing in this publication constitutes an offer, recommendation or solicitation to buy or sell any securities. Further research is advised. This report is copyrighted and no redistribution is permitted with out permission.)