![]()
|
|
|
Go to Video Show - "How to Make Money With Breakout Stocks |
|---|

By Leo Fasciocco -- TTD
Ticker Tape Digest presents its daily stock market report containing stocks to go long as Breakout Trades, Quick Trades, or Bargain Accumulation Trades.
We also feature stocks under Significant Accumulation that are poised to breakout.
|
Ticker Tape Digest's Daily schedule guide for TTD subscribers 1. Pre-market - check Breakout Watch List and Quick Trades. 2. Morning - (11:30 - 12 A.M.) - check breakout stocks tape and breakout chart slide show. 3. Midday (1 P.M.) check TTD Midsession Report and see market video show. 4. After close (4 P.M.) check final TTD Report for day. Trading Strategies Bullish Aggressive Investors Bullish - "Breakout Stocks" - ideally suited for bull markets and special situation stocks. Potential for large returns. (See Performance) Aggressive Investor Bullish- "Quick Trade Stocks" -ideally suited for entry into top performing issues looking for a small quick profit." (See Performance) Conservative Investors "Bargain Buy Trades for the Long Term." Ideally suited for entry into top performing big cap stocks on pullbacks within overall up trend.(See Performance) Bearish Aggressive Bearish Investors - "Breakdown Stocks" to Sell Short. Ideally suited for bear markets or market pull backs. Potential for large returns (See Performance) |
|---|
The TTD report also contains stocks to short as breakdown plays and as bargain (swing trade) shorts.
Investors should tend to try to go with a strategy that fits with the stock market's trend, unless there is a special situation play.
TTD's Breakout Stocks - Long are
most suitable for aggressive investors seeking ideal entry points into leading stocks, especially during bull markets. They can do extremely well in bull markets with gains of as much as several hundred percent. 
These stocks can also do extremely well during strong market rallies, or if they are in a industry group that is performing very well. They tend to have strong earnings outlooks and are near new-52 week, or all-time highs.
TTD Swng - Quick Trade Stocks - Long These are leading issues that have pulled back in recent days, but could move higher soon. They are most suitable for Aggressive Investors willing to trade short term. These stocks will do extremely well during market advances. They have about 74% win rate. During market rally sequences the win rate is even higher. The return is small 3% to 8% in just a few days.
TTD also presents Stocks To Sell or Sell Short. These issues are suitable for aggressive investors willing to take short positions both as trades or for longer-term plays. These stocks will do very well during bear markets or market pull backs.
TTD's Bearish breakdown stocks to sell short. These issues have potential to fall sharply. They often show a technical breakdown and also some fundamental business problem such as weak earnings.
TTD's multi-media updates include a slide-show that presents charts and analysis at midsession. Some times TTD presents feature analysis on stocks and the market. TTD uses Windows Media Files. (WMV).
TTD also presents a "Breakout Watch List" that is up dated daily. This list consists of key stocks in position to breakout. A close watch of this list can put you in the stock just as it breaks out. A good idea is to study the list and be ready to move into a stock quickly as it hits its breakpoint.
TTD often suggests using stop buy orders to enter. It is very important to buy a breakout stock as close as possible to the breakpoint. The idea is to get "elbow room" if the stock should follow through to the upside. This is very important in being successful in making big money with breakout stocks.
It is also essential to have a stop loss strategy for all stocks in which positions are taken. Not every stock will work as expected. It is important for investors to "police" their portfolios and avoid getting trapped in any bad positions.
Quality rating of breakout Two key factors: 1 - Stock near all-time high in price or near a 52-week high. 2 - earnings growth current year is strong. The ideal play is a stock with an Above Average Quality Rating. The stock is near a new high and will have strong earnings. TTD's other ratings are Average and Below Average.
TTD also has special feature sections on Educational Tips on Investing.
To email Mr. Leo Fasciocco leo@tickertapedigest.com.
For service, email Beverly Owen owen@tickertapedigest.com. TTDÆs Tel: 1-480-878-8381 or 480-704-3331.
Thursday - May 13, 2021
TTD's Breakout Stocks
Stock Market Overview
Total Buy Breakouts - 5
Quality of Breakouts - Average.
Stocks Screened - 12,234
Bull side - Small list of breakouts, but some interesting plays.
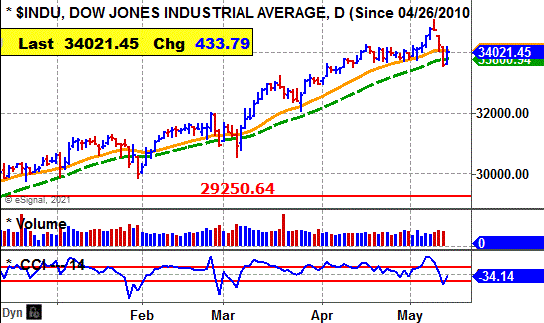
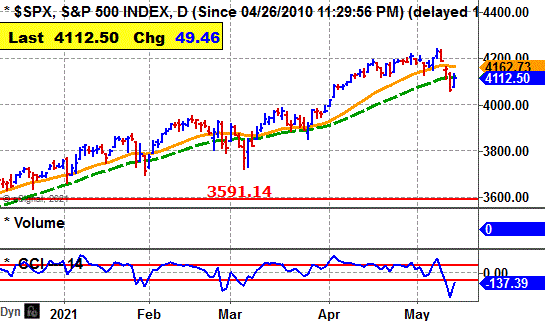
Stock market - Major daily averages and week Nasdaq remain bearish. The other averages holding bullish.
Comment - Bulls be conservative as stock market is still vulnerable to the downside
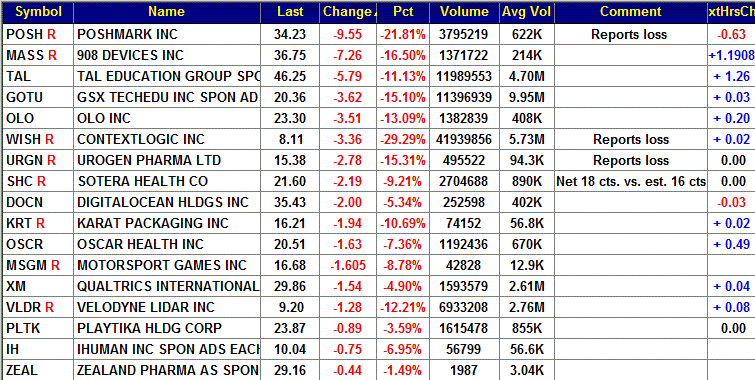
See Latest Earnings Reports - A company that tops the Street's highest earnings estimate has potential to go higher. Key earnings beats - CIXX, THRY and YETI.
Stock Market Momentum
(Daily is based on a moving average)
|
Market (Daily) |
Market (Weekly) |
Market (Monthly) |
|
Dow - Bearish |
Dow - Bullish |
Dow - Bullish |
|
Nasdaq - Bearish |
Nasdaq - Bearish |
Nasdaq - Bullish |
|
S&P 500 - Bearish |
S&P 500 - Bullish |
S&P 500 - Bullish |
 Ticker Tape Digest's
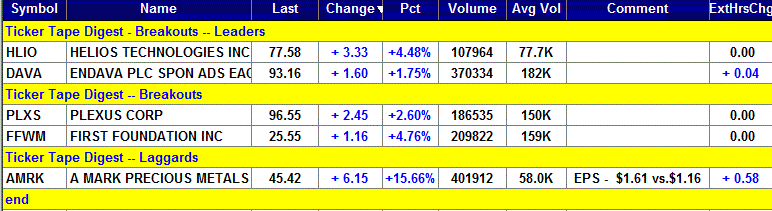
|
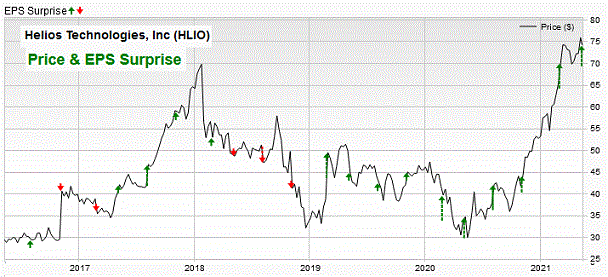
TTD's Quality Rating of Stock - HLIO - ABOVE AVERAGE |
HLIO, based in Sarasota, Fla., formerly Sun Hydraulics Corp., makes hydraulics and electronics products. Annual revenues: $523 million. HLIO's stock drives sharply higher Thursday and breaks out from its nine-week flat base. 
So far today, HLIO is trading 107,964 shares. Its average daily volume is 78,000 shares.
TTD sees potential for more on the upside, especially since the stock is now at a new all-time high.
That means there is little overhead resistance. 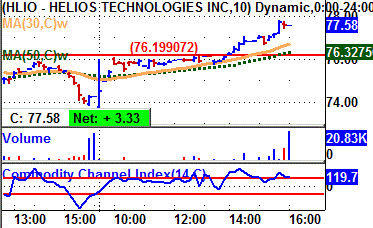
HLIO 's stock moved higher in the morning.
It cleared its breakpoint line in the afternoon.
It drove higher peaking near the close with a big point gain.
The stock was unchanged in after-hours trading.
Tape Action
HLIO's tape action shows the recent block trades.
One can see the price for the blocks climbing from $74.47 in the morning to as high as $77.58 by the close.
A key bullish trade came in the morning when a block of 500 shares crossed at $75.66.
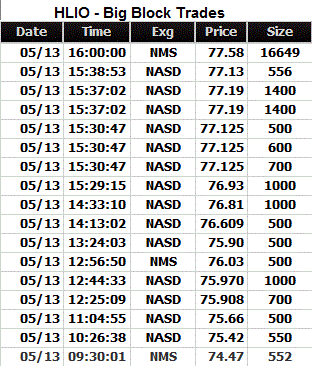 That was up from the prior block at $75.42 on 550 shares.
Near the close a big block of 16,649 shares crossed the tape at $77.58.
That was up from the prior block at $77.13 on 556 shares.
Business
HLIO makes products for the hydraulics and electronics markets.
It is engaged in power controls and vehicle technologies lines of business.
It makes screw-in hydraulic cartridge valves, electro-hydraulics, manifolds, and integrated package solutions for mobile hydraulics markets.
Charts
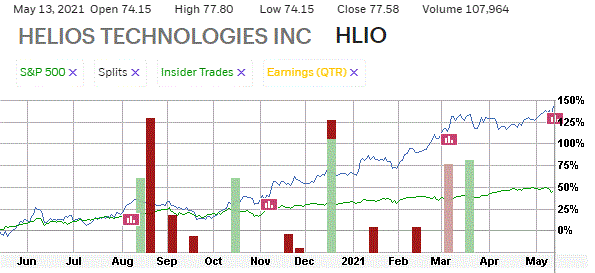
HLIO's 12-month performance chart shows the stock up 135% versus a 45% gain for the stock market.
Insiders were recent buyers using stock options. The price was not disclose.
They were sellers at $39.61 to $60.
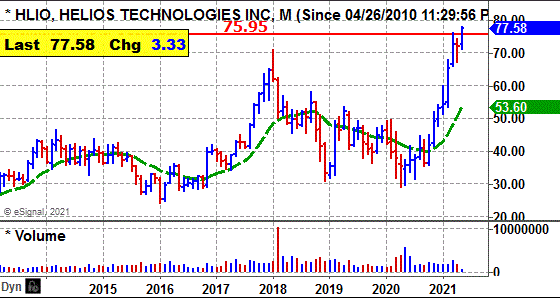
HLIO's long-term chart shows the stock climbing from $24 in 2015 to a peak at $70 by 2018.
 The stock then fell back to $29 in early 2020. However, it has now surged to $77.
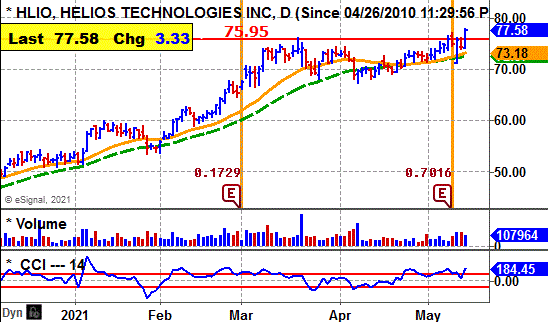
HLIO's daily chart shows the stock advancing from $50 in December to a peak at $75.95 in March.
The stock formed a tight flat base.
The breakout clears the base and reaches a new high.
The stock's CCI momentum indicator is solidly bullish.
Earnings Outlook
This year, analysts predict a 34% jump in net to $3.01 a share from the $2.24 the prior year.
The stock has a price-earnings ratio of 25.
Looking out to 2022, the Street expects a 16% rise in net to $3.48 a share from the anticipated $3.01 this year.
Quarterly earnings will be strong.
Net for the second quarter should spurt 51% to 83 cents a share from the 55 cents the prior year.
The highest estimate is at 90 cents a share.
The company topped the Street estimate the past four quarters by 25 cents a share, 18 cents, 11 cents and 27 cents.
Net for the third quarter should leap 49% to 79 cents a share from the 53 cents the prior year.
Strategy Opinion: TTD is targeting HLIO for a move to 90 within the next few months, or sooner.
A protective stop can be placed near $73
Intermediate-Term Rating: Average.
Suitability: Average Bulls.
TTD's special research of Stock's Prior Performance:
|
Breakout Success |
Bullish |
HLIO scored big gains off recent breakouts. |
|
Response to Net |
Neutral |
HLIO rose 8 times after 16 earnings reports. |
|
Seasonal Success |
Bullish |
HLIO avg. gain 0.1% in May, 3% in June prior years. |
|
Earnings Beats |
Bullish |
HLIO beat Street net estimate 10 times after 10 reports. |
Stock's Prior Performance After A Breakout
|
Stock's % Change from Breakout to peak - prior to cut below 50-day M/A. |
Date of Breakout |
Break point Price |
Stocks Price Peak after Breakout - prior to cut below 50-day M/A |
Date Trade Closed |
|
22% |
2/12/2021 | 60.60 | 74.19 | 3/19/21 |
|
34% |
11/9/2020 | 44.46 | 59.52 | 1/12/2021 |
|
27% |
7/9/2018 | 45 | 57.33 | 10/9/2017 |
|
28% |
11/8/2016 | 32.61 | 41.78 | 12/9/2016 |
(In actual trading, entry and exit points could vary depending on broker execution.
Also, ideal are breakouts to a new 52-week high or better, perhaps all-time highs.)
Stock's Long-term Chart
Stock's Price Performance after Reporting Earnings
Stock's Performance Chart with Quarterly Earnings Markers vs. S&P 500
Insider Buying in Green - Insider Selling in Red
Charts of Selected Breakout Stocks
|
TTD's Quality Rating of Stock - DAVA - ABOVE AVERAGE |

|
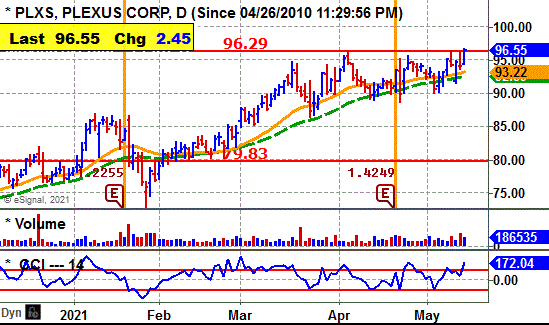
TTD's Quality Rating of Stock - PLXS - AVERAGE |
|
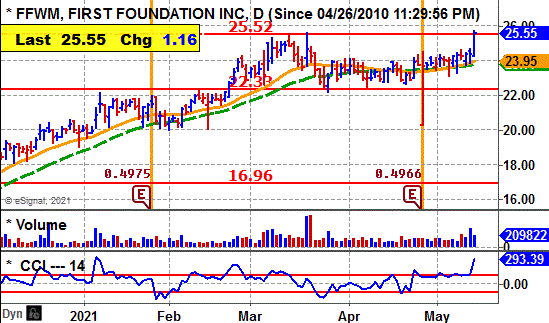
TTD's Quality Rating of Stock - FFWM - AVERAGE |
|
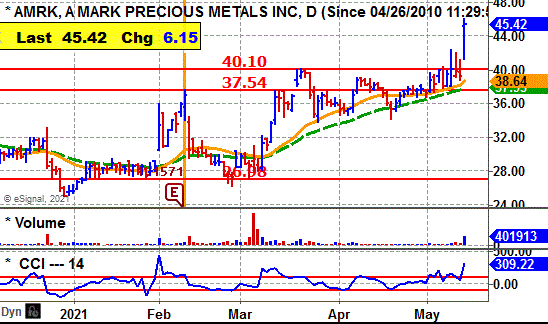
TTD's Quality Rating of Stock - AMRK - BELOW AVERAGE |

Ticker Tape DigestÆs Daily List of ōStocks To Sell or Sell Shortö ranks stocks well timed to be sold immediately based on daily trading. The list can be used as an alert to reduce current long-term positions.
Shorts from tape action - 17
Stocks Screened - 12,234
Long-Term Environment for bears: Favorable as many stocks are breaking down.
Bear Side - Large list of shorts with several interesting plays for aggressive bears.
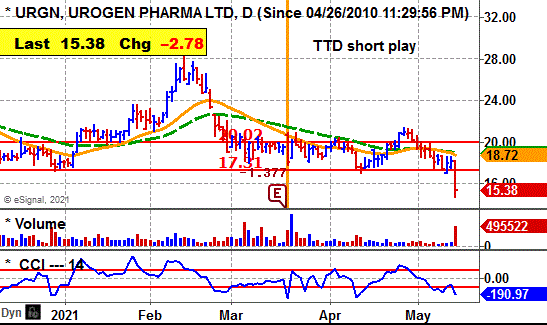
URGN, based in Israel, is a biotech firm working on treatments for cancer and urologic diseases. Annual revenues: $11.8 million. URGN's stock falls sharply with heavy volume Thursday. 
The decline comes after the company reported a loss for the quarter.
The stock's move undercuts technical support. TTD sees potential for more on the downside.
So far today, URGN is trading a heavy 495,547 shares, five times its average daily volume of 94,000 shares. 
URGN's stock fell in the morning and undercut key support.
The stock touched an intraday low in the morning at $14.66.
URGN then trended sideways the rest of the day.
In after-hours trading, the stock was up 42 cents a share.
Tape Action
URGN's tape action shows the recent block trades.
One can see the price for the blocks falling from $18.16 in the prior session to as low as $15.10 in the afternoon.
A key bearish trade came in the morning when a block of 4,800 shares crossed the tape at $16.30.
That was down from the prior block the day before at $18.16 on 10,860 shares.
Business
URGN is working on solutions to treat cancers and urologic diseases.
URG has developed RTGelTM reverse-thermal hydrogel, a proprietary sustained release, hydrogel-based platform technology that has the potential to improve therapeutic profiles of existing drugs.
Its lead product candidates include MitoGel and VesiGel are formulated using its proprietary reverse thermally triggered hydrogel, or RTGel, technology.
Earnings:
Analysts expect URGN to show a loss of $4.70 a share this year compared with a loss of $5.90 the prior year.
Going out to 2022, the Street predicts a loss of $2.65 a share.
Charts:
URGN's daily chart shows the stock falling from $28 back in February down to $17 by April.
The stock rallied, but now has since rolled over and is near to make a new all-time low. Its prior low was $13.01 in 2017 when it came public.
Strategy Opinion: TTD is targeting URGN for a decline to $12 within the next few months, or sooner. A protective stop buy can be placed near $16.50
Suitability: Aggressive Bears.
TTD's Stock Probability research of Prior Performance:
|
Response to Net |
Bearish |
URGN rose 2 times after 9 earnings reports. |
|
Seasonal Success |
Bullish |
URGN rose avg 4.8% in May, 0.2% in June prior years. |
|
Earnings Beats |
Bearish |
URGN beat Street estimate 5 times after 14 reports. |
|
TTD's Quality Rating of Stock - URGN - BELOW AVERAGE |
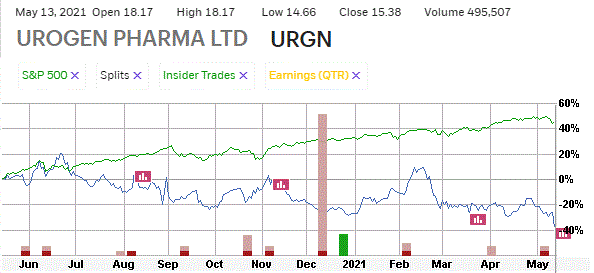
Stock's Performance Chart with Quarterly Earnings Markers vs. S&P 500
Insider Buying in Green - Insider Selling in Red
TTD columnist Leo Fasciocco has covered the stock market for over 30 years. His articles appear in many publications. He has also been a speaker at the Money Show conferences. He has been on television and radio. He is author of many educational articles about stock investing and the book ōGuide To High-Performance Investing.ö

For information to subscribe to the Ticker Tape Digest Services call: Beverly Owen at 1-480-704-3331.
Distributed by Corona Publishing Enterprises. TickerTape Digest Inc. 1220 W. Sherri, Gilbert, Az. 85233.
TTD ōProfessional Reportö is available on the Web: $100 per month. Password needed. Published daily - around 20 times a month.
TTD Pro Report includes a Morning chart slide show of breakout stocks, a Midsession video-audio show with commentary on breakout stocks and shorts and a Final end of day overall report on breakout stocks for the session, short plays and accumulation plays. There are other features too such as Quick Trades and Long-term Plays.
TTD Daily Report is $39. It covers a Morning slide show of charts of stocks breaking out and a TTD end of day print report covering breakout stocks and shorts.
Credit cards accepted. Payable to Corona Publishing Enterprises.
(The information contained has been prepared from data deemed reliable but there is no guarantee of complete accuracy. Ticker Tape Digest Inc. is not affiliated with any broker, dealer or investment advisor. Nothing in this publication constitutes an offer, recommendation or solicitation to buy or sell any securities. Further research is advised. This report is copyrighted and no redistribution is permitted with out permission.)