|
Weekly - Bullish Conservative Investors - Go To TTD Long-Term Plays - Monday, May 16 |
|
Go to Video Show - "How to Make Money With Breakout Stocks" Go to Video Show -TTD Performance 2008 Long and Short |
|---|

By Leo Fasciocco -- TTD
Ticker Tape Digest presents its daily stock market report containing stocks to go long as breakout trades, quick trades, or bargain trades. We also feature stocks under  Significant Accumulation that are poised to breakout.
|
Ticker Tape Digest's Trading Strategies Overview and Performance Bullish Aggressive Investors Bullish - "Breakout Stocks" - ideally suited for bull markets and special situation stocks. Potential for large returns. Aggressive Investor Bullish- "Quick Trade Stocks" -ideally suited for entry into top performing issues looking for a small quick profit." Conservative Investors "Bargain Buy Trades for the Long Term." Ideally suited for entry into top performing big cap stocks on pullbacks within overall up trend. Bearish Aggressive Bearish Investors - "Breakdown Stocks" to Sell Short. Ideally suited for bear markets or market pull backs. Potential for large returns |
|---|
The TTD report also contains stocks to short as breakdown plays and as bargain (swing trade) shorts.
Investors should tend to try to go with a strategy that fits with the stock market's trend, unless there is a special situation play.
1 - TTD's Breakout Stocks - Long - (Intermediate-term long plays) these are most suitable for aggressive investors seeking ideal entry points into leading stocks, especially during bull markets. They can do extremely well in bull markets with gains of as much as several hundred percent.
These stocks can also do extremely well during strong market rallies, or if they are in a industry group that is performing very well. They tend to have strong earnings outlooks and are near new-52 week, or all-time highs.
2 -TTD Quick Trade Stocks - Long - (Short-term long plays These are leading issues that have pulled back in recent days, but could move higher soon. They are most suitable for Aggressive Investors willing to trade short term. These stocks will do extremely well during market advances. They have about 74% win rate. During market rally sequences the win rate is even higher. The return is small 3% to 8% in just a few days.
3 - TTD's Bargain Buy Trades - Long - (Long Term long plays. These are for conservative bullish Investors These long-term buys are ideally suited for entry into stocks on pull backs within overall up trend. These stocks can give a good return long-term especially during a bull market.
TTD also presents Stocks To Sell or Sell Short. These issues are suitable for aggressive investors willing to take short positions both as trades or for longer-term plays. These stocks will do very well during bear markets or market pull backs.
4 - TTD's Bearish breakdown stocks to sell short. These issues have potential to fall sharply. They often show a technical breakdown and also some fundamental business problem such as weak earnings.
TTD's multi-media updates include a slide-show that presents charts and analysis at midsession. Some times TTD presents feature analysis on stocks and the market. TTD uses Windows Media Files. (WMV).
TTD also presents a "Breakout Watch List" that is up dated daily. This list consists of key stocks in position to breakout. A close watch of this list can put you in the stock just as it breaks out. A good idea is to study the list and be ready to move into a stock quickly as it hits its breakpoint.
TTD often suggests using stop buy orders to enter. It is very important to buy a breakout stock as close as possible to the breakpoint. The idea is to get "elbow room" if the stock should follow through to the upside. This is very important in being successful in making big money with breakout stocks.
It is also essential to have a stop loss strategy for all stocks in which positions are taken. Not every stock will work as expected. It is important for investors to "police" their portfolios and avoid getting trapped in any bad positions.
Quality rating of breakout Two key factors: 1 - Stock near all-time in price or near a 52-week high. 2 - earnings growth current year is strong. The ideal play is a stock with an Above Average Quality Rating. The stock is near a new high and will have strong earnings. TTD's other ratings are Average and Below Average.
TTD also has special feature sections on Educational Tips on Investing.
To email Mr. Leo Fasciocco leo@tickertapedigest.com.For service, email Beverly Owen owen@tickertapedigest.com. TTD’s Tel: 1-480-926-1680.
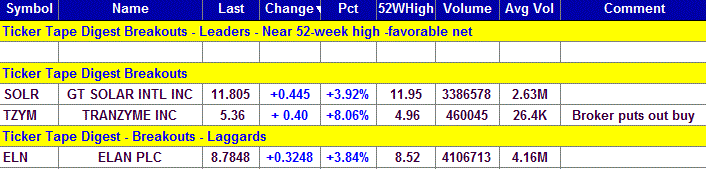
Breakout Stocks
Total Buy Breakouts so far today - 3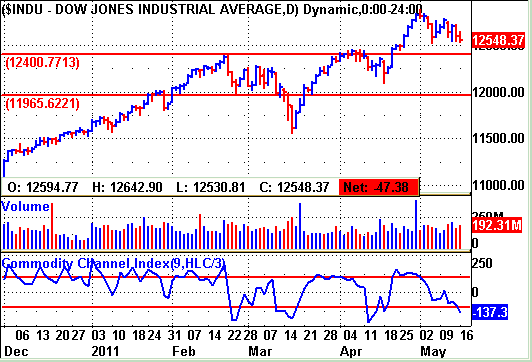
Overall Quality of Breakouts - Average
Stocks Screened - 8,300
Bull side - Below average quality and small list of breakouts today. Stock market moves broadly lower. Bulls be conservative and watchful of all stops.
(Put mouse on Dow chart to see Nasdaq chart)
Long Term Environment for bulls: Neutral
Market (Daily) - NYSE Bearish, Nasdaq Bearish
Market (Weekly) - NYSE Bearish, Nasdaq Bearish
Market (Monthly) - NYSE Bullish, Nasdaq Bearish
Ticker Tape Digest's
(See Top Performing Breakout Stocks for 2011)
|
TTD's Quality Rating of Stock - SOLR - AVERAGE |
SOLR, based in Merrimack, N.H., makes equipment used in the production of materials for solar items. Annual revenues: $822 million. SOLR's stock breaks out today from an 18-week flat base. The stock got a boost when the company announced a big order for DSS Crystalization Growth Furnaces. So far today, SOLR is trading a heavy 4.3 million shares. Its average daily volume is 2.6 million shares.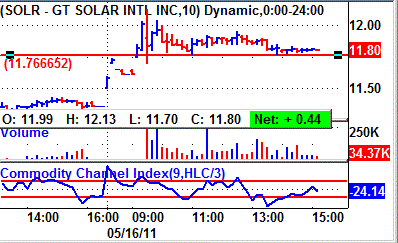

TTD highlighted SOLR as a breakout at our midsession show on the Web Monday.
SOLR's 10-minute chart shows the stock driving sharply higher in the morning on strong volume. The stock cleared its breakpoint. It was able to hold the breakout even though the stock market was under selling pressure.
SOLR said the new orders were worth $84.3 million. SOLR will report earnings on May 19 - this week.
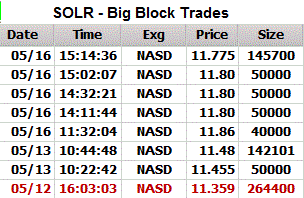 SOLR's clip of the tape shows its recent big block trades.
One can see the price for the blocks jumping in the morning. That was when 40,000 shares crossed the tape at $11.86. That was up from the prior block trade at $11.48.
Later in the day, a big block of 145,700 shares crossed the tape at $11.77. That was down from the prior block at $11.80. So that would indicate some institutional profit taking.
SOLR produces specialized manufacturing equipment and services for the production of photovoltaic wafers, cells and modules and polysilicon.
The company's principal products are directional solidification systems and chemical vapor deposition reactors and related equipment.
Its customers are in the chemical industry. The products are used to make solar cells.
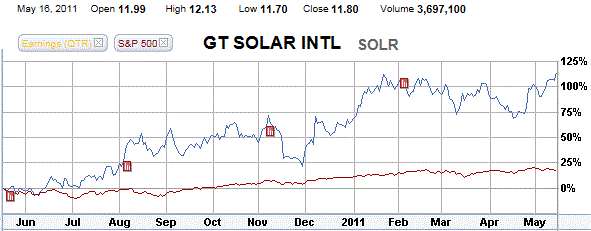
SOLR's 12-month performance chart shows the stock appreciating 110% versus a 15% gain for the S&P 500 index. The stock has been a top performer over the past few months.
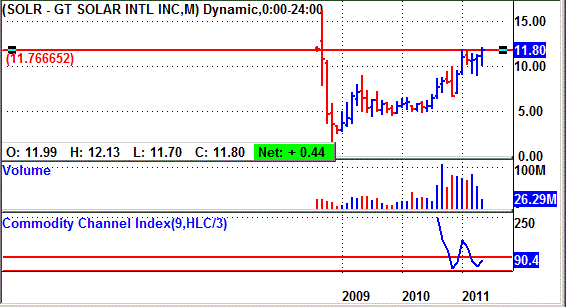
SOLR's long-term chart shows the stock coming public in late 2008 and trading around 12. The stock was pulled lower by the bear market sinking to as low as 88 cents in 2008. The stock has since made a sensational comeback and is now around 11.
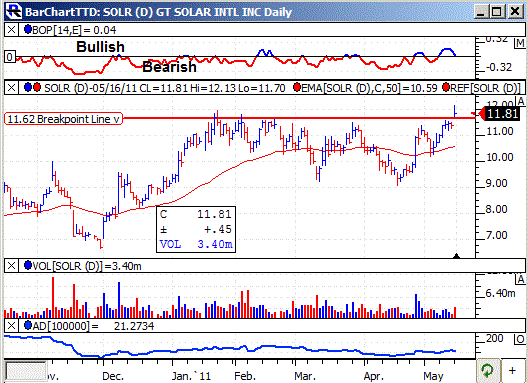
SOLR's daily chart shows the stock advancing from 7 late last year to a peak near 12. The stock then put down a three-month base. Today, it gaps higher on the news of the order.
The stock's TTD momentum indicator (top of chart) is neutral
The accumulation - distribution line ( bottom of chart) is trending sideways.
SOLR is expected to report net for the fiscal fourth quarter ended March 31 soon. The Street is looking for a 47% gain in net to 34 cents a share from 23 cents a year ago.
The highest estimate is at 36 cents a share. TTD sees good chances for an upside surprise. The past four quarters SOLR topped the consensus estimate by 8 to 3 cents a share.
Overall, net for the year ending in March should soar 97% to $1.18 a share from 60 cents a year ago. The stock sells with a price-earnings ratio of just 10. TTD sees that as low making the stock attractive on a valuation basis.
Going out to fiscal 2012 ending in March, analysts predict a 20% gain in net to $1.42 a share from the anticipated $1.18 a share.
Net for the fiscal first quarter ending June 30 should surge 226% to 36 cents a share from 11 cents a year ago. The highest estimate is at 57 cents a share.
Strategy Opinion: TTD is targeting SOLR for a move to 16 within the next few months, or sooner. A protective stop can be place near 10. TTD rates SOLR a very good intermediate-term play as long as earnings meet expectations.
Sponsorship: Good. The largest fund holder is Fidelity Advisor Small Cap Fund with a 5.2% stake. The 4-star rated fund was a recent seller of 4.3 million shares. However, 5-star rated Neuberger Bermand Genesis Fund, the second largest fundholder, was a recent buyer of 891,000 shares. SOLR has 124.9 million shares.
Insider Activity: Neutral. Insiders were buyers using stock options, but they turned around and sold. The latest selling was at $9.41 in April. Currently, 12 analysts follow the stock, 9 have a buy, up from 7 three months ago.
Stock Performance Chart with Quarterly Earnings Markers.
| TTD's Breakout Profile
Rating GT Solar International Inc. - (SOLR) |
| TTD Check List | Bullish | Bearish | Neutral |
| Near 52-week High | YES | ||
| Volume | YES | ||
| Tick Volume | YES | ||
| Price Trend - Daily | YES | ||
| Price Trend - Long Term | YES | ||
| Price Daily Spread | YES | ||
| Base Structure | YES | ||
| Base - A-D | YES | ||
| Earnings-Quarterly | YES | ||
| Earnings-Long Term | YES | ||
| Earnings Outlook | YES | ||
| Industry Group | YES | ||
| Prior Breakout Success | YES | ||
| Fund Sponsorship | YES | ||
| Total Score | 13 | 0 | 1 |
Charts of Selected Breakout Stocks
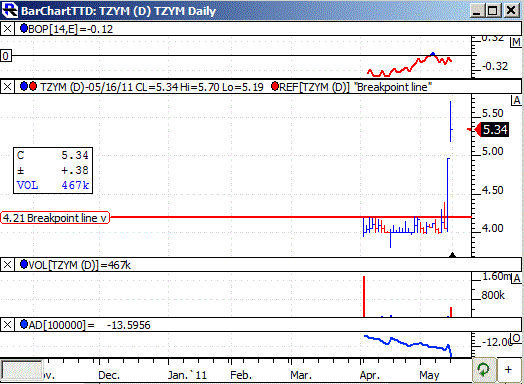
| TTD's Quality Rating of Stock - TZYM - AVERAGE |
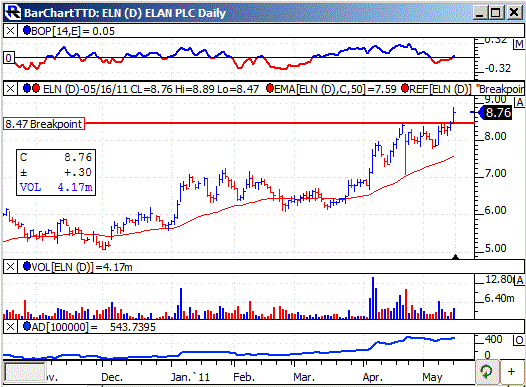
| TTD's Quality Rating of Stock - ELN - BELOW AVERAGE |

Ticker Tape Digest’s Daily List of “Stocks To Sell or Sell Short” ranks stocks well timed to be sold immediately based on daily trading. The list can be used as an alert to reduce current long-term positions.
Shorts from tape action so far today - 4
Stocks Screened - 8,300
Long-Term Environment for bears: Unfavorable.
Bear Side - Just a few breakdown issues today even as the stock market heads lower. Bears be selective. TTD's short from Friday was E House China Holdings Ltd (EJ) at 10.50. Today, the stock has declined to 10.29 and is working well for bears.
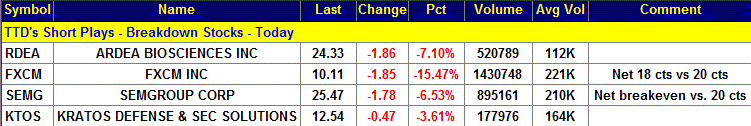
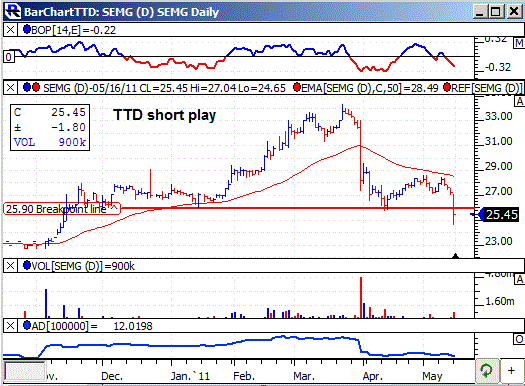
SEMG, based in Tulsa, provides transportation and storage for petroleum products. Annual revenues: $1.5 billion. SEMG's stock falls sharply today after the company reported weak earnings for the first quarter. So far today, SEMG is trading 1.4 million shares, seven times its normal daily volume of 210,000 shares. TTD sees more on the downside. 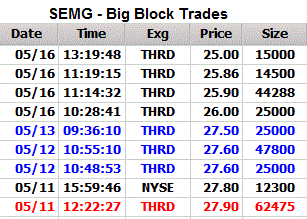
SEMG was highlighted by TTD at our midsession show on the Web Friday as a bear play.
SEMG reported first quarter net declined to a breakeven versus a profit of 20 cents a share a year ago. Revenues came in at $407 million, down from $476 million a year ago.
SEMG's stock headed south in the morning. It had a "burp rally" in the afternoon, but then rolled over again to make a new intraday low at $24.37.
SEMG's tape action shows clear selling pressure with the price of its block trades declining from $27.90 to $25. A key bearish trade came in the morning when 25,000 shares crossed the tape at $26. That was down from the prior block trade at $27.50.
SEMG provides gathering, transportation, storage, distribution, blending, marketing and other midstream services to producers, refiners of petroleum products.
The company operates in the pipeline gathering and processing segments of the natural gas midstream industry in the U.S. and Canada.
SEMG's daily chart shows the stock peaking near 34. It then went into a decline and tried to hold support near 26. However, today, the stock breaks down with volume on the bearish earnings news. The stock's accumulation - distribution line (bottom of chart) is bearish.
Strategy Opinion: TTD is targeting SEMG for a decline to 21 within the next few months, or sooner. A protective stop buy can be placed near 26.80.
| TTD's Quality Rating of Stock - SEMG - BELOW AVERAGE |
TTD columnist Leo Fasciocco has covered the stock market for over 20 years. His articles appear in many publications. He is also a speaker at the Intershow conferences. He has been on television and radio. He is author of many educational articles about stock investing and the book “Guide To High-Performance Investing.”

For information to subscribe to the Ticker Tape Digest Services call: B. J. Owen at 1-480-926-1680. Distributed by Corona Publishing Enterprises. Ticker Tape Digest Inc. P.O. Box 2044 Chandler, Az. 85244-2044. TTD “Professional Report” is available on the World Wide Web: $100 per month. Password needed. “TTD Professional“ Faxed is $200 per month. The TTD Daily Report is $39.95. Credit cards accepted.
(The information contained has been prepared from data deemed reliable but there is no guarantee of complete accuracy. Ticker Tape Digest Inc. is not affiliated with any broker, dealer or investment advisor. Nothing in this publication constitutes an offer, recommendation or solicitation to buy or sell any securities. Further research is advised. This report is copyrighted and no redistribution is permitted with out permission.)