Daily - Go to TTD's Tape of Stock Charts - Thursday, May 16, 2013
|
Daily - Go to TTD's Tape of Stock Charts - Thursday, May 16, 2013 |
|
Weekly - Bullish Conservative Investors - Go To TTD Long-Term Plays - Monday, May 13, 2013 |
|
Go to Video Show - "How to Make Money With Breakout Stocks" |
|---|

By Leo Fasciocco -- TTD
Ticker Tape Digest presents its daily stock market report containing stocks to go long as breakout trades, quick trades, or bargain trades. We also feature stocks under Significant Accumulation that are poised to breakout.
|
Ticker Tape Digest's Daily schedule guide for TTD subscribers 1. Pre-market - check Breakout Watch List and Quick Trades. 2. Morning - (11:30 - 12 A.M.) - check breakout stocks tape and breakout chart slide show. 3. Midday (1 P.M.) check TTD Midsession Report and see market video show. 4. After close (4 P.M.) check final TTD Report for day. Trading Strategies Bullish Aggressive Investors Bullish - "Breakout Stocks" - ideally suited for bull markets and special situation stocks. Potential for large returns. (See Performance) Aggressive Investor Bullish- "Quick Trade Stocks" -ideally suited for entry into top performing issues looking for a small quick profit." (See Performance) Conservative Investors "Bargain Buy Trades for the Long Term." Ideally suited for entry into top performing big cap stocks on pullbacks within overall up trend.(See Performance) Bearish Aggressive Bearish Investors - "Breakdown Stocks" to Sell Short. Ideally suited for bear markets or market pull backs. Potential for large returns (See Performance) |
|---|
The TTD report also contains stocks to short as breakdown plays and as bargain (swing trade) shorts.
Investors should tend to try to go with a strategy that fits with the stock market's trend, unless there is a special situation play.
TTD's Breakout Stocks - Long are most suitable for aggressive investors seeking ideal entry points into leading stocks, especially during bull markets. They can do extremely well in bull markets with gains of as much as several hundred percent.
These stocks can also do extremely well during strong market
rallies, or if they are in a industry group that is performing very well. They tend to have strong earnings outlooks and are near new-52 week, or all-time highs. 
TTD Quick Trade Stocks - Long These are leading issues that have pulled back in recent days, but could move higher soon. They are most suitable for Aggressive Investors willing to trade short term. These stocks will do extremely well during market advances. They have about 74% win rate. During market rally sequences the win rate is even higher. The return is small 3% to 8% in just a few days.
TTD's Bargain Buy Trades - Long - Long Term. These are for conservative bullish Investors These long-term buys are ideally suited for entry into stocks on pull backs within overall up trend. These stocks can give a good return long-term especially during a bull market.
TTD also presents Stocks To Sell or Sell Short. These issues are suitable for aggressive investors willing to take short positions both as trades or for longer-term plays. These stocks will do very well during bear markets or market pull backs.
TTD's Bearish breakdown stocks to sell short. These issues have potential to fall sharply. They often show a technical breakdown and also some fundamental business problem such as weak earnings.
TTD's multi-media updates include a slide-show that presents charts and analysis at midsession. Some times TTD presents feature analysis on stocks and the market. TTD uses Windows Media Files. (WMV).
TTD also presents a "Breakout Watch List" that is up dated daily. This list consists of key stocks in position to breakout. A close watch of this list can put you in the stock just as it breaks out. A good idea is to study the list and be ready to move into a stock quickly as it hits its breakpoint.
TTD often suggests using stop buy orders to enter. It is very important to buy a breakout stock as close as possible to the breakpoint. The idea is to get "elbow room" if the stock should follow through to the upside. This is very important in being successful in making big money with breakout stocks.
It is also essential to have a stop loss strategy for all stocks in which positions are taken. Not every stock will work as expected. It is important for investors to "police" their portfolios and avoid getting trapped in any bad positions.
Quality rating of breakout Two key factors: 1 - Stock near all-time in price or near a 52-week high. 2 - earnings growth current year is strong. The ideal play is a stock with an Above Average Quality Rating. The stock is near a new high and will have strong earnings. TTD's other ratings are Average and Below Average.
TTD also has special feature sections on Educational Tips on Investing.
To email Mr. Leo Fasciocco leo@tickertapedigest.com.For service, email Beverly Owen owen@tickertapedigest.com. TTD’s Tel: 1-480-926-1680.
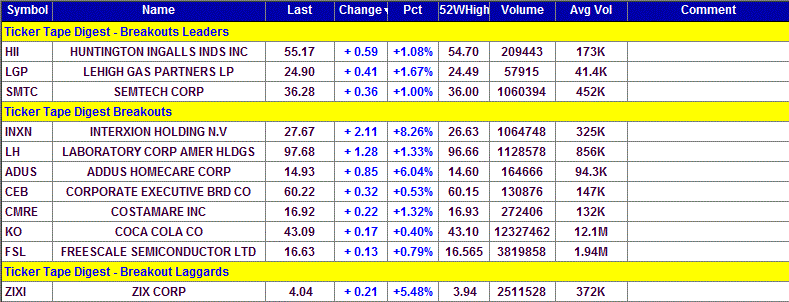
Breakout Stocks
Total Buy Breakouts so far today - 11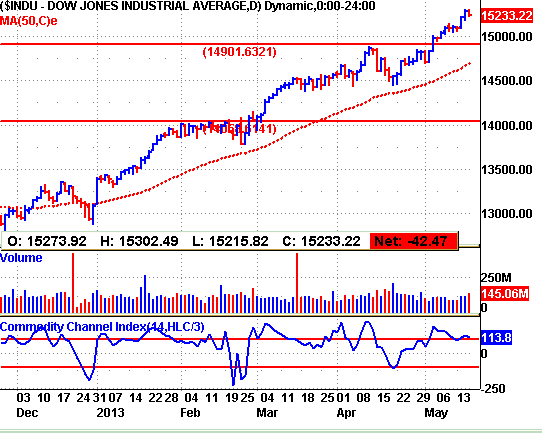
Overall Quality of Breakouts - Above Average
Stocks Screened - 8,300
Bull side - Breakout list showing some quality plays. Semiconductor stocks on the move. Bulls be selective. Stock market remains in up trend.
(Put mouse on Dow chart to see Nasdaq chart)
Long Term Environment for bulls: Favorable
Market (Daily) - NYSE Bullish, Nasdaq Bullish
Market (Weekly) - NYSE Bullish, Nasdaq Bullish
Market (Monthly) - NYSE Bullish, Nasdaq Bullish
Ticker Tape Digest's
(See Top Performing Breakout Stocks for 2011- 2012)
|
TTD's Quality Rating of Stock - SMTC - ABOVE AVERAGE |
SMTC, based in Camarillo, Ca., makes semiconductors used in computer and communications products. Annual revenues: $578 million. SMTC's stock breaks out today from an eight-week, cup-and-handle type play. So far today, SMTC is trading 1.1 million shares, double its average daily volume of 452,000 shares. 
TTD highlighted SMTC as a breakout at our midsession video show on the Web Thursday.
The stock pushed higher in the morning and then trended sideways. The stock held comfortably above its breakpoint line. 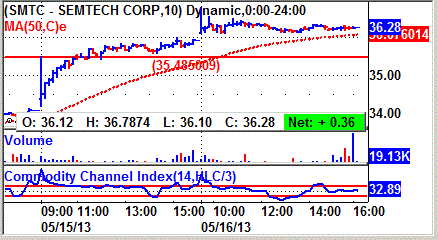
Semiconductor stocks are showing good strength. They tend to move as orders pick up, not so much when earnings do. However, SMTC is poised to show good earnings results.
SMTC's tape action shows the recent block trades. One can see the price of the stock for the blocks working higher from $34.37 to as high as $36.29.
A key bullish trade came in the morning when a block of 10,403 shares (duplicated) crossed the tape at $36.12. That was up from the prior block at $35.92. 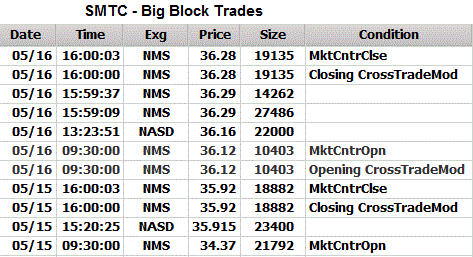
SMTC makes analog and mixed-signal semiconductors, including Standard Semiconductor Products, Rectifier and Assembly Products.
The company's devices are used in computers, communications products, industrial, military-aerospace and automotive items.
The company also provides a limited amount of wafer foundry services to other electronic component manufacturers.
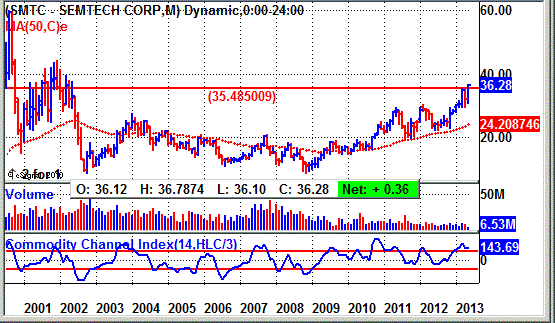
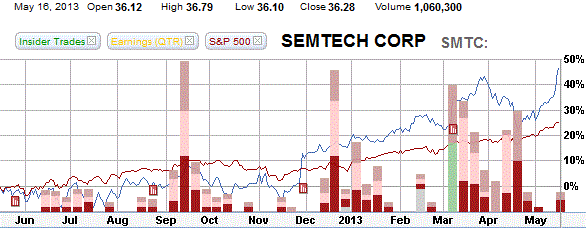
SMTC's 12-month performance chart shows the stock appreciating 48% versus a 24% gain in the stock market.
SMTC's long-term chart shows the stock climbing from its bear market low of 9 back in 2008 to 36 - a fourfold move. The stock was as high as 60 back in 2000 during the internet bull market. 
SMTC's daily chart shows the stock climbing from 14 back in November to a peak of 35 by late March.
The stock then pulled back and formed its cup-and-handle base. There is no handle on this set up.
Sometimes with stocks that are strong they will not pause buy move higher.
The stock's TTD momentum indicator (top of chart) is strongly bullish.
The accumulation - distribution line (bottom of chart) has broken out to the upside.
TTD sees earnings being the key driver for the stock.
This fiscal year ending in January of 2014, the Street is projecting a 42% surge in net to $1.90 a share from $1.33 a year ago. The stock sells with a price-earnings ratio of 18. TTD sees that as low making the stock a value play for investors willing to go with a semiconductor play.
Going out to fiscal 2015, profits should be up 20% to $2.27 a share from the anticipated $1.90 for fiscal 2014. 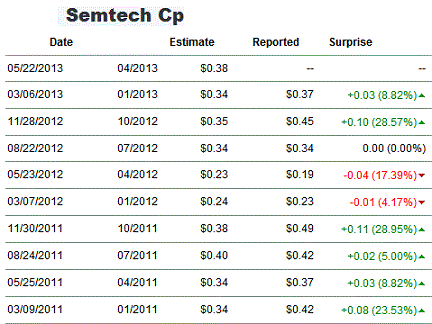
For the upcoming fiscal first quarter ending in April, the Street looks for a robust 63% leap in profits to 38 cents a share from 23 cents a year ago. The highest estimate by analysts is at 39 cents a share. The company topped the Street estimate the past two quarters. by 9% and 29%.
For the fiscal second quarter, net should climb 22% to 46 cents a share from 37 cents the year before.
Strategy Opinion: TTD is targeting SMTC for a move to 44 off this breakout. A protective stop can be placed near 33.
TTD rates SMTC a good intermediate-term play for aggressive investors.
Sponsorship: Very Good. The largest fund holder is Buffalo Small Cap Fund, 4-star rated, with a 3.9% stake. It has held its position steady. A key buyer recently was 4-star rated Goldman Sachs Small Cap Value Fund which purchased 40,089 shares.
SMTC has 67.4 million shares outstanding.
Insider Activity: Bearish. Insiders were recent buyers using stock options at $13 to $16. They were sellers around $31 to $33. Right now, six analysts follow the stock, and all have a buy, the same sentiment as three months ago.
Stock Performance Chart with Quarterly Earnings Markers.
| TTD's Breakout Profile
Rating Semtech Corp. - (SMTC) |
| TTD Check List | Bullish | Bearish | Neutral |
| Near 52-week High | YES | ||
| Volume | YES | ||
| Tick Volume | YES | ||
| Price Trend - Daily | YES | ||
| Price Trend - Long Term | YES | ||
| Price Daily Spread | YES | ||
| Base Structure | YES | ||
| Base - A-D | YES | ||
| Earnings-Quarterly | YES | ||
| Earnings-Long Term | YES | ||
| Earnings Outlook | YES | ||
| Industry Group | YES | ||
| Prior Breakout Success | YES | ||
| Fund Sponsorship | YES | ||
| Total Score | 13 | 0 | 1 |
Charts of Selected Breakout Stocks
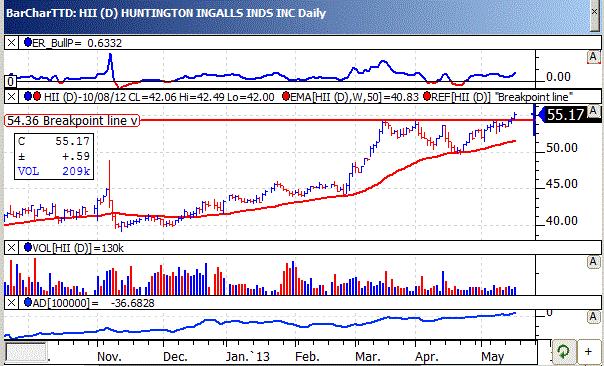
| TTD's Quality Rating of Stock - HII - ABOVE AVERAGE |
| TTD's Quality Rating of Stock - LGP - ABOVE AVERAGE |

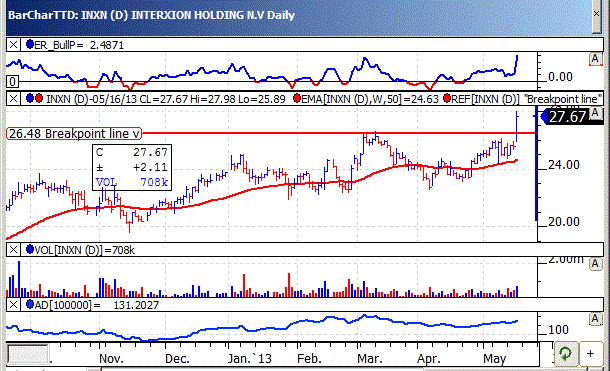
| TTD's Quality Rating of Stock - INXN - AVERAGE |
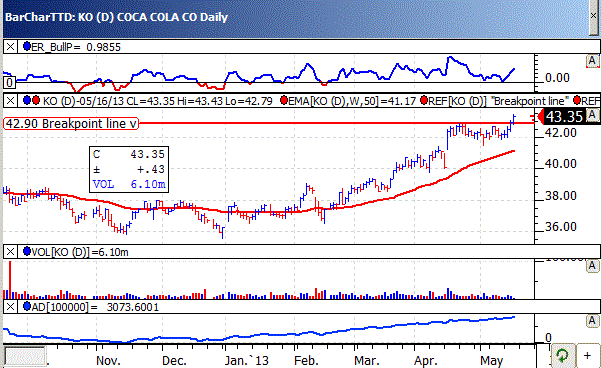
| TTD's Quality Rating of Stock - KO - AVERAGE |

Ticker Tape Digest’s Daily List of “Stocks To Sell or Sell Short” ranks stocks well timed to be sold immediately based on daily trading. The list can be used as an alert to reduce current long-term positions.
Shorts from tape action so far today - 2
Stocks Screened - 8,300
Long-Term Environment for bears: Unfavorable.
Bear Side - Just a few breakdown stocks today as stock market holds up trend. Bears be conservative. TTD's short from Wednesday was First Majestic Silver (AG) at 10.32. Today, the stock has declined to 10.12 and is working well for bears.
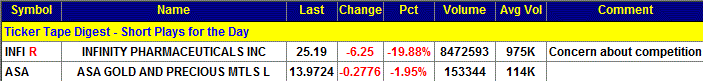
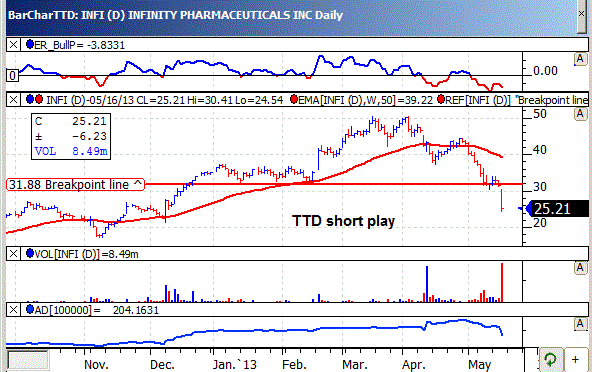
INFI, based in Cambridge, Ma., products drugs to treat cancer. Annual revenues: $21.9 million. INFI's stock falls sharply today due to reported concerns about its drug and possible competition. So far today, INFI is trading a heavy 9.2 million shares, almost ten times its average daily volume of 975,000 shares. TTD sees more on the downside. 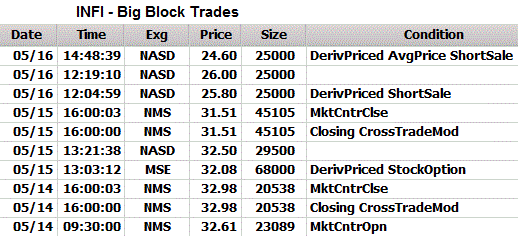
Analysts said leukemia-drug competitors of INFI had strong, if incremental, data releases late Wednesday.
JP Morgan said investors are "growing increasingly skittish" ahead of June's ASCO cancer conference, where INFI is expected to release safety and tolerability data for its drug.
JP Morgan said it expects "a good showing" but it may not be enough to outshine competitors.
INFI's stock fell steadily in the morning. It then trended sideways through midsession. However, late in the day the stock is starting to weaken again.
INFI's tape action shows the recent block trades. One can see heavy institutional distribution. The price for the blocks declined from $32.98 on Tuesday to $24.60. A key bearish trade came in the morning when a block of 25,000 shares crossed the tape at $25.80. That was down sharply from the prior block at $31.51.
This year, analysts are forecasting INFI will show a loss of $2.49 a share compared with a loss of $3.02 a year before. For the second quarter, the Street expects a loss of 62 cents a share compared with a loss of 54 cents a year ago.
INFI's daily chart shows INFI breaking down from a head-and-shoulder pattern. It has undercut key technical support near 31. The stock's TTD momentum indicator (top of chart) is solidly bearish.
Strategy Opinion: TTD is targeting INFI for a decline to 20 within the next few months, or sooner. A protective stop buy can be placed near 26.60.
| TTD's Quality Rating of Stock - INFI - AVERAGE |
TTD columnist Leo Fasciocco has covered the stock market for over 20 years. His articles appear in many publications. He is also a speaker at the Intershow conferences. He has been on television and radio. He is author of many educational articles about stock investing and the book “Guide To High-Performance Investing.”

For information to subscribe to the Ticker Tape Digest Services call: B. J. Owen at 1-480-926-1680. Distributed by Corona Publishing Enterprises. Ticker Tape Digest Inc. P.O. Box 2044 Chandler, Az. 85244-2044. TTD “Professional Report” is available on the World Wide Web: $100 per month. Password needed. “TTD Professional“ Faxed is $200 per month. The TTD Daily Report is $39.95. Credit cards accepted.
(The information contained has been prepared from data deemed reliable but there is no guarantee of complete accuracy. Ticker Tape Digest Inc. is not affiliated with any broker, dealer or investment advisor. Nothing in this publication constitutes an offer, recommendation or solicitation to buy or sell any securities. Further research is advised. This report is copyrighted and no redistribution is permitted with out permission.)