Daily - Go to TTD's Tape of Stock Charts - Friday. May 16, 2014
|
Daily - Go to TTD's Tape of Stock Charts - Friday. May 16, 2014 |
|
Weekly - Bullish Conservative Investors - Go To TTD Long-Term Plays - Monday, May 12, 2013 |
|
Go to Video Show - "How to Make Money With Breakout Stocks" |
|---|

By Leo Fasciocco -- TTD
Ticker Tape Digest presents its daily stock market report containing stocks to go long as breakout trades, quick trades, or bargain trades. We also feature stocks under Significant Accumulation that are poised to breakout.
|
Ticker Tape Digest's Daily schedule guide for TTD subscribers 1. Pre-market - check Breakout Watch List and Quick Trades. 2. Morning - (11:30 - 12 A.M.) - check breakout stocks tape and breakout chart slide show. 3. Midday (1 P.M.) check TTD Midsession Report and see market video show. 4. After close (4 P.M.) check final TTD Report for day. Trading Strategies Bullish Aggressive Investors Bullish - "Breakout Stocks" - ideally suited for bull markets and special situation stocks. Potential for large returns. (See Performance) Aggressive Investor Bullish- "Quick Trade Stocks" -ideally suited for entry into top performing issues looking for a small quick profit." (See Performance) Conservative Investors "Bargain Buy Trades for the Long Term." Ideally suited for entry into top performing big cap stocks on pullbacks within overall up trend.(See Performance) Bearish Aggressive Bearish Investors - "Breakdown Stocks" to Sell Short. Ideally suited for bear markets or market pull backs. Potential for large returns (See Performance) |
|---|
The TTD report also contains stocks to short as breakdown plays and as bargain (swing trade) shorts.
Investors should tend to try to go with a strategy that fits with the stock market's trend, unless there is a special situation play.
TTD's Breakout Stocks - Long are most suitable for aggressive investors seeking ideal entry points into leading stocks, especially during bull markets. They can do extremely well in bull markets with gains of as much as several hundred percent.
These stocks can also do extremely well during strong market
rallies, or if they are in a industry group that is performing very well. They tend to have strong earnings outlooks and are near new-52 week, or all-time highs. 
TTD Quick Trade Stocks - Long These are leading issues that have pulled back in recent days, but could move higher soon. They are most suitable for Aggressive Investors willing to trade short term. These stocks will do extremely well during market advances. They have about 74% win rate. During market rally sequences the win rate is even higher. The return is small 3% to 8% in just a few days.
TTD's Bargain Buy Trades - Long - Long Term. These are for conservative bullish Investors These long-term buys are ideally suited for entry into stocks on pull backs within overall up trend. These stocks can give a good return long-term especially during a bull market.
TTD also presents Stocks To Sell or Sell Short. These issues are suitable for aggressive investors willing to take short positions both as trades or for longer-term plays. These stocks will do very well during bear markets or market pull backs.
TTD's Bearish breakdown stocks to sell short. These issues have potential to fall sharply. They often show a technical breakdown and also some fundamental business problem such as weak earnings.
TTD's multi-media updates include a slide-show that presents charts and analysis at midsession. Some times TTD presents feature analysis on stocks and the market. TTD uses Windows Media Files. (WMV).
TTD also presents a "Breakout Watch List" that is up dated daily. This list consists of key stocks in position to breakout. A close watch of this list can put you in the stock just as it breaks out. A good idea is to study the list and be ready to move into a stock quickly as it hits its breakpoint.
TTD often suggests using stop buy orders to enter. It is very important to buy a breakout stock as close as possible to the breakpoint. The idea is to get "elbow room" if the stock should follow through to the upside. This is very important in being successful in making big money with breakout stocks.
It is also essential to have a stop loss strategy for all stocks in which positions are taken. Not every stock will work as expected. It is important for investors to "police" their portfolios and avoid getting trapped in any bad positions.
Quality rating of breakout Two key factors: 1 - Stock near all-time in price or near a 52-week high. 2 - earnings growth current year is strong. The ideal play is a stock with an Above Average Quality Rating. The stock is near a new high and will have strong earnings. TTD's other ratings are Average and Below Average.
TTD also has special feature sections on Educational Tips on Investing.
To email Mr. Leo Fasciocco leo@tickertapedigest.com.For service, email Beverly Owen owen@tickertapedigest.com. TTD’s Tel: 1-480-926-1680.
Breakout Stocks
Total Buy Breakouts so far today - 2
Overall Quality of Breakouts - AVERAGE
Stocks Screened - 8,300
Bull side - Breakout list small. Bulls be patient and selective. Stock market rallies to finish higher. However, it is still locked in a trading range.
(Put mouse on Dow chart to see Nasdaq chart)
Long Term Environment for bulls: Favorable
Stock Market Momentum
Market (Daily) - NYSE Bearish, Nasdaq Bearish
Market (Weekly) - NYSE Bullish, Nasdaq Bullish
Market (Monthly) - NYSE Bullish, Nasdaq Bearish
Ticker Tape Digest's
|
TTD's Quality Rating of Stock - CFN - AVERAGE |
CFN, based in San Diego, produces products for medication management. Annual revenues: $3.6 billion. CFN's stock breaks out today from a 15-week, flat base. The move carries the stock, which came public in 2009, to a new all-time high. So far today, CFN is trading 3.1 million shares, up from its average daily volume of 1.8 million shares. 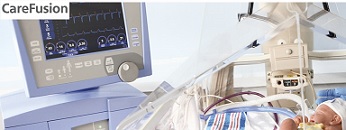
TTD highlighted CFN as a breakout at our midsession video show on the Web Friday.
CFN's stock raced higher in the morning bucking the stock market's decline.
The stock cleared its breakpoint and reached an intraday peak of 43.13 in the morning. The stock the pulled back but held above the breakpoint. 
In the afternoon, CFN turned up and finished strong well above its breakpoint line.
CFN's tape action shows the recent block trades.
One can see the price for the blocks climbing from $41.77 to as high as $43.08 Friday morning.
The key bullish trade came in the morning when a block of 40,000 shares crossed the tape at $42.48.
That was up from the prior block at $41.77. The tape showed good institutional buying interest. 
CFN makes products for medication management, infection prevention, operating room effectiveness, respiratory care and surveillance and analytics.
Some of its main product brands include Alaris intravenous infusion systems; Pyxis automated medication dispensing and supply management systems, AVEA, Vela and LTV Series respiratory ventilators.
It also makes ChloraPrep skin antiseptic products, MaxGuard, MaxPlus and SmartSite needle-free IV infusion disposable sets.
CFN's 12-month performance chart shows the stock appreciating 27% versus a 13% gain for the stock market.
The stock has a tendency to move higher after it reports earnings.
CFN's long-term chart shows the stock coming public back in 2009 and trading around $19. The stock advanced t 30 by 2010, but met resistance at that level. It then traded in a range for the next three years moving back and fourth from 30 to 21.
However, in 2013 it cleared the resistance and has since move to 42, a new all-time high.
CFN's daily chart shows the stock driving through key upside resistance at $41.70.
The stock showed a good expansion in volume in the prior session when it poked above the breakpoint line briefly.
CFN's TTD momentum indicator (top of chart) is extremely bullish. That shows good upside technical momentum.
The accumulation - distribution line (bottom of chart) has supported the recent advance.
Analysts are forecasting a 9% increase in CFN's earnings this year to $2.31 a share from $2.12 a year ago.
The stock sells with a price-earnings ratio of 18. TTD sees that as reasonable.
Going out to fiscal 2015 ending in June, the Street looks for a 16% increase in profits to $2.68 a share from $2.31 in fiscal 2014.
Net for the next two quarters will be very strong. 
For the upcoming fiscal fourth quarter ending in June, analysts predict a 31% surge in profits to 72 cents a share from 55 cents a year ago.
The highest estimate on the Street is at 75 cents a share. The company has topped the Street six out of the past nine quarters. (See table)
Looking ahead to the first quarter of fiscal 2015, the Street predicts a 21% gain in net to 53 cents a share from 44 cents the year before.
Strategy Opinion: TTD is targeting CFN for a move to 49 off this breakout. The stock is a conservative play but is entering an earnings sequence that should give it a lift.
A protective stop can be placed near 39.80.
TTD rates CFN an average intermediate-term play most suitable for conservative investors.
Sponsorship: Very Good. The largest fund holder is the 5-star rated T. Rowe Price Mid-Cap Growth Fund with a 3% stake. It has kept its position steady.
The largest fund buyer recently was the 3-star rated Champlain Mid Cap Fund which purchased 801,730 shares.
CFN has 207 million shares outstanding. Institutions hold 97% of the stock.
Insider Activity: Slightly Bearish. Insiders were recent buyers using stock options around $14 to $17. They were sellers around $40. Currently, 11 analysts follow the stock, 5 have a buy, the same sentiment as three months ago.
Stock Performance Chart with Quarterly Earnings Markers.

| TTD's Breakout Profile
Rating Carefusion Corp. - (CFN) |
| TTD Check List | Bullish | Bearish | Neutral |
| Near 52-week High | YES | ||
| Volume | YES | ||
| Tick Volume | YES | ||
| Price Trend - Daily | YES | ||
| Price Trend - Long Term | YES | ||
| Price Daily Spread | YES | ||
| Base Structure | YES | ||
| Base - A-D | YES | ||
| Earnings-Quarterly | YES | ||
| Earnings-Long Term | YES | ||
| Earnings Outlook | YES | ||
| Industry Group | YES | ||
| Prior Breakout Success | YES | ||
| Fund Sponsorship | YES | ||
| Total Score | 12 | 0 | 2 |
Charts of Selected Breakout Stocks
| TTD's Quality Rating of Stock - JWN - AVERAGE |

Ticker Tape Digest’s Daily List of “Stocks To Sell or Sell Short” ranks stocks well timed to be sold immediately based on daily trading. The list can be used as an alert to reduce current long-term positions.
Shorts from tape action so far today - 10
Stocks Screened - 8,300
Long-Term Environment for bears: Neutral.
Bear Side - Good number of shorts Friday. Stock market rallies to finish up. Bears be selective.
CLF, based in Cleveland, produces iron ore products. Annual revenues: $5.5 billion. CLF's stock declines today undercutting key technical support and setting off a TTD short play. So far today, CLF is trading a heavy 7.9 million shares. Its average daily volume is 4.4 million shares. TTD sees more on the downside. 
CLF's stock fell in the morning hitting an intraday low of 16.43. The stock then lifted modestly and trended sideways the rest of the day nursing a loss.
It was unable to rally effectively with the stock market which finished in the black.
CLF's tape action shows the recent block trades.
One can see the price for the blocks declining from $17.44 in the prior session to as low as $16.50 on Friday.
A key bearish trade came when a block of 43,289 shares crossed the tape near the opening at $17.07.
That was down sharply from the prior block trade at $17.44 on 48,178 shares.
The company produces iron ore pellets in North America, a major supplier of direct-shipping lump and fines iron ore out of Australia, and a significant producer of metallurgical coal.
This year, analysts are forecasting an 86% drop in profits to 54 cents a share from $3.84 a year ago. Net for the upcoming second quarter should fall 85% to 19 cents a share from $1.20 a year ago.
CLF's daily chart shows the stock trending lower from 27 back in January. The stock tried to use 17 as support. However, that gives in and the stock falls through support with volume picking up. CLF's accumulation - distribution line (bottom of chart) is trending lower showing heavy selling pressure.
Strategy Opinion: TTD is targeting CLF for a decline to 13.20 within the next few months or sooner, a protective stop buy can be placed near 17.90.
| TTD's Quality Rating of Stock - CLF - BELOW AVERAGE |
TTD columnist Leo Fasciocco has covered the stock market for over 20 years. His articles appear in many publications. He is also a speaker at the Intershow conferences. He has been on television and radio. He is author of many educational articles about stock investing and the book “Guide To High-Performance Investing.”

For information to subscribe to the Ticker Tape Digest Services call: B. J. Owen at 1-480-926-1680. Distributed by Corona Publishing Enterprises. Ticker Tape Digest Inc. P.O. Box 2044 Chandler, Az. 85244-2044. TTD “Professional Report” is available on the World Wide Web: $100 per month. Password needed. “TTD Professional“ Faxed is $200 per month. The TTD Daily Report is $39.95. Credit cards accepted.
(The information contained has been prepared from data deemed reliable but there is no guarantee of complete accuracy. Ticker Tape Digest Inc. is not affiliated with any broker, dealer or investment advisor. Nothing in this publication constitutes an offer, recommendation or solicitation to buy or sell any securities. Further research is advised. This report is copyrighted and no redistribution is permitted with out permission.)