![]()
|
|
|
Go to Video Show - "How to Make Money With Breakout Stocks |
|---|

By Leo Fasciocco -- TTD
Ticker Tape Digest presents its daily stock market report containing stocks to go long as Breakout Trades, Quick Trades, or Bargain Accumulation Trades.
We also feature stocks under Significant Accumulation that are poised to breakout.
|
Ticker Tape Digest's Daily schedule guide for TTD subscribers 1. Pre-market - check Breakout Watch List and Quick Trades. 2. Morning - (11:30 - 12 A.M.) - check breakout stocks tape and breakout chart slide show. 3. Midday (1 P.M.) check TTD Midsession Report and see market video show. 4. After close (4 P.M.) check final TTD Report for day. Trading Strategies Bullish Aggressive Investors Bullish - "Breakout Stocks" - ideally suited for bull markets and special situation stocks. Potential for large returns. (See Performance) Aggressive Investor Bullish- "Quick Trade Stocks" -ideally suited for entry into top performing issues looking for a small quick profit." (See Performance) Conservative Investors "Bargain Buy Trades for the Long Term." Ideally suited for entry into top performing big cap stocks on pullbacks within overall up trend.(See Performance) Bearish Aggressive Bearish Investors - "Breakdown Stocks" to Sell Short. Ideally suited for bear markets or market pull backs. Potential for large returns (See Performance) |
|---|
The TTD report also contains stocks to short as breakdown plays and as bargain (swing trade) shorts.
Investors should tend to try to go with a strategy that fits with the stock market's trend, unless there is a special situation play.
TTD's Breakout Stocks - Long are
most suitable for aggressive investors seeking ideal entry points into leading stocks, especially during bull markets. They can do extremely well in bull markets with gains of as much as several hundred percent. 
These stocks can also do extremely well during strong market rallies, or if they are in a industry group that is performing very well. They tend to have strong earnings outlooks and are near new-52 week, or all-time highs.
TTD Swng - Quick Trade Stocks - Long These are leading issues that have pulled back in recent days, but could move higher soon. They are most suitable for Aggressive Investors willing to trade short term. These stocks will do extremely well during market advances. They have about 74% win rate. During market rally sequences the win rate is even higher. The return is small 3% to 8% in just a few days.
TTD also presents Stocks To Sell or Sell Short. These issues are suitable for aggressive investors willing to take short positions both as trades or for longer-term plays. These stocks will do very well during bear markets or market pull backs.
TTD's Bearish breakdown stocks to sell short. These issues have potential to fall sharply. They often show a technical breakdown and also some fundamental business problem such as weak earnings.
TTD's multi-media updates include a slide-show that presents charts and analysis at midsession. Some times TTD presents feature analysis on stocks and the market. TTD uses Windows Media Files. (WMV).
TTD also presents a "Breakout Watch List" that is up dated daily. This list consists of key stocks in position to breakout. A close watch of this list can put you in the stock just as it breaks out. A good idea is to study the list and be ready to move into a stock quickly as it hits its breakpoint.
TTD often suggests using stop buy orders to enter. It is very important to buy a breakout stock as close as possible to the breakpoint. The idea is to get "elbow room" if the stock should follow through to the upside. This is very important in being successful in making big money with breakout stocks.
It is also essential to have a stop loss strategy for all stocks in which positions are taken. Not every stock will work as expected. It is important for investors to "police" their portfolios and avoid getting trapped in any bad positions.
Quality rating of breakout Two key factors: 1 - Stock near all-time high in price or near a 52-week high. 2 - earnings growth current year is strong. The ideal play is a stock with an Above Average Quality Rating. The stock is near a new high and will have strong earnings. TTD's other ratings are Average and Below Average.
TTD also has special feature sections on Educational Tips on Investing.
To email Mr. Leo Fasciocco leo@tickertapedigest.com.
For service, email Beverly Owen owen@tickertapedigest.com. TTDÆs Tel: 1-480-878-8381 or 480-704-3331.
Thursday - June 3, 2021
TTD's Breakout Stocks
Stock Market Overview
Total Buy Breakouts - 10
Quality of Breakouts - Above Average.
Stocks Screened - 12,234
Bull side - Large list of breakouts with some good looking plays.
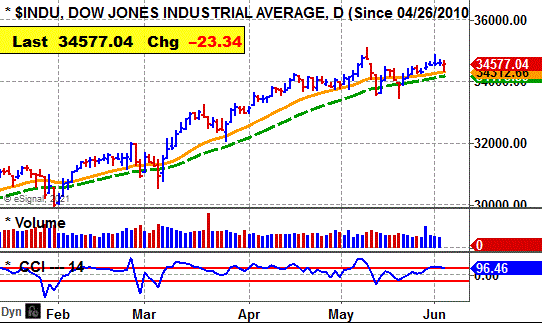
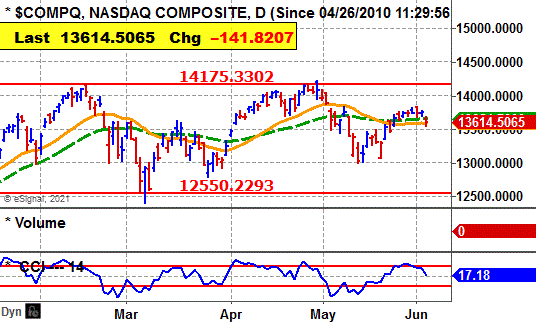
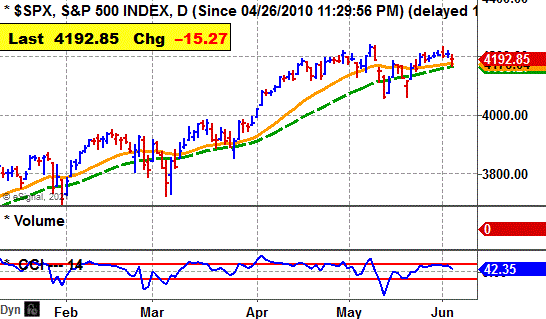
Stock market - Major averages still hold bullish in all time zones.
Comment - Stock market in a consolidation pattern. Bulls must remain alert.
See Latest Earnings Reports - A company that tops the Street's highest earnings estimate has potential to go higher. Key earnings beats - CONN, SCWX, CIEN, JOAN and SJM.
Stock Market Momentum
(Daily is based on a moving average)
|
Market (Daily) |
Market (Weekly) |
Market (Monthly) |
|
Dow - Bullish |
Dow - Bullish |
Dow - Bullish |
|
Nasdaq - Bullish |
Nasdaq - Bullish |
Nasdaq - Bullish |
|
S&P 500 - Bullish |
S&P 500 - Bullish |
S&P 500 - Bullish |
 Ticker Tape Digest's
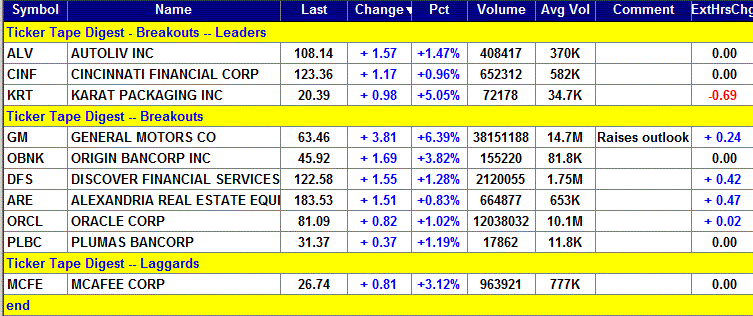
|
TTD's Quality Rating of Stock - ALV - ABOVE AVERAGE |
ALV, based in Stockholm, produces vehicle safety systems. Annual revenues: $7.4 billion. ALV's stock moves higher Thursday and breaks out from its 7-week, cup-and-handle base. 
The stock is close to making a new all-time. That is bullish.
TTD sees potential for more on the upside. TTD highlighted ALV as a breakout at our midsession video show.
So far today, ALV is trading 408,417 shares. Its average daily volume is 370,000 shares. 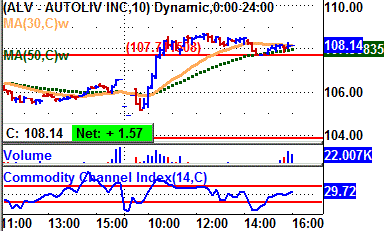
ALV's stock ran up in the morning and cleared its breakpoint line.
The stock then trended sideways the rest of the day and held above its breakpoint line.
ALV was unchanged in after hours trading.
Tape Action
ALV's tape action shows the recent block trades.
One can see the price for the blocks climbing from $105.56 in the morning to as high as $108.14 near the close.
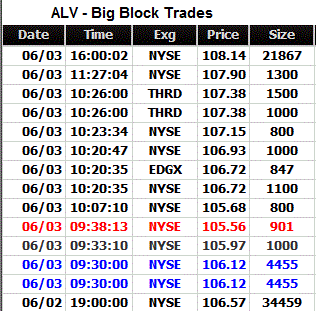 A key bullish trade came in the morning when a block of 800 shares crossed the tape at $105.68.
That was up from the prior block at $105.56 on 901 shares.
Then near the close a massive block of 21,867 shares crossed at $108.14.
That was up from the prior block at $107.90 on 1,300 shares.
Business
ALV works on vehicle safety systems with a broad range of product offerings, primarily passive safety systems.
A passive safety system includes modules and components for frontal-impact airbag protection systems, side-impact airbag protection systems.
It also works on seatbelts, steering wheels, inflator technologies, battery cable cutters and protection systems for vulnerable road users such as pedestrians and cyclists.
ALV operates through 14 technical centers with 20 test tracks and in 27 countries.
Charts
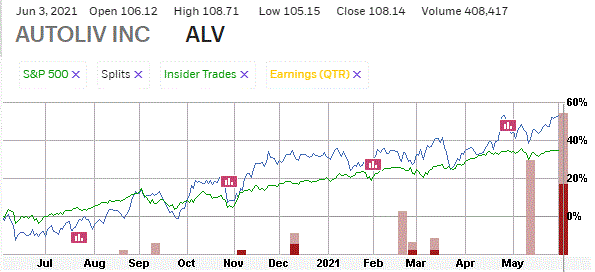
ALV's 12-month performance chart shows the stock up 50% versus a 37% gain for the stock market.
Insiders were recent sellers at $103 to $89 a share recently.
They were buyers at $51 to $67 a share using stock options.
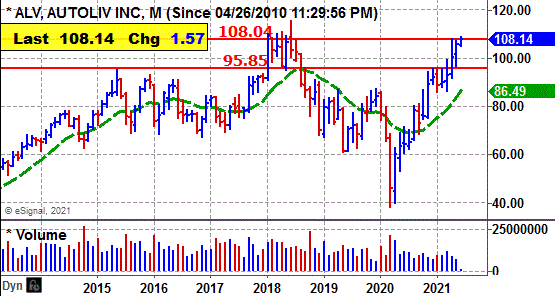
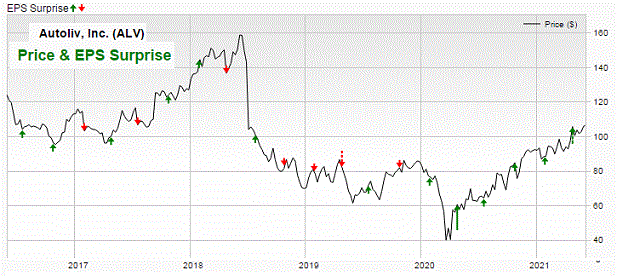
 ALV's long-term chart shows the stock climbing from around $60 back in 2013 to a peak at $115 by 2018.
The stock then fell back to $40 in 2020 due in part to the stock market decline.
However, since then ALV has climbed back to $108.
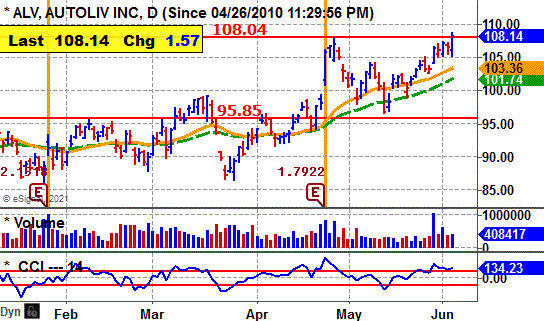
ALV's daily chart shows the stock breaking out from a base in April when it reported earnings.
The stock rose to around $108.
It then pulled back and formed a cup-and-handle base.
The breakout clears the base nicely.
Earnings Outlook
This year, analysts predict a 113% jump in net to $6.70 a share from the $3.15 the prior year.
The stock has a price-earnings ratio of 16.
Looking out to 2022, the Street projects a 26% lift in net to $8.44 a share from the anticipated $6.70 this year.
Net for the second quarter should climb to $1.53 a share versus a loss of $1.40 the prior year.
Net for the third quarter is expected to be off 2% to $1.45 a share from the $1.48 the previous year.
Strategy Opinion: TTD is targeting ALV for a move to $128 within the next few months, or sooner.
A protective stop can be placed near $104.
Intermediate-Term Rating: Average.
Suitability: Average Bulls.
TTD's special research of Stock's Prior Performance:
|
Breakout Success |
Bullish |
ALV scored big gains off recent breakouts. |
|
Response to Net |
Bullish |
ALV rose 8 times after 15 earnings reports. |
|
Seasonal Success |
Bullish |
ALV avg. gain 2.8% in June, 0.3% in July prior years. |
|
Earnings Beats |
Bullish |
ALV beat Street net estimate 13 times after 20 reports. |
Stock's Prior Performance After A Breakout
|
Stock's % Change from Breakout to peak - prior to cut below 50-day M/A. |
Date of Breakout |
Break point Price |
Stocks Price Peak after Breakout - prior to cut below 50-day M/A |
Date Trade Closed |
|
8% |
4/13/2021 | 99.07 | 107.02 | 4/27/2021 |
|
12% |
8/25/2020 | 71.74 | 79.85 | 9/2/2020 |
|
18% |
1/3/2018 | 93.13 | 109.65 | 1/31/2018 |
|
21% |
1/30/2015 | 77.89 | 94.23 | 5/20/2015 |
(In actual trading, entry and exit points could vary depending on broker execution.
Also, ideal are breakouts to a new 52-week high or better, perhaps all-time highs.)
Stock's Long-term Chart
Stock's Price Performance after Reporting Earnings
Stock's Performance Chart with Quarterly Earnings Markers vs. S&P 500
Insider Buying in Green - Insider Selling in Red
Charts of Selected Breakout Stocks
|
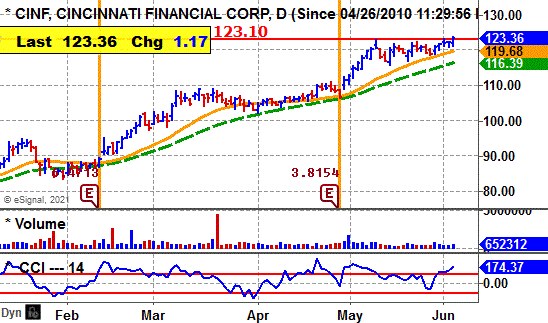
TTD's Quality Rating of Stock - CINF - ABOVE AVERAGE |
|
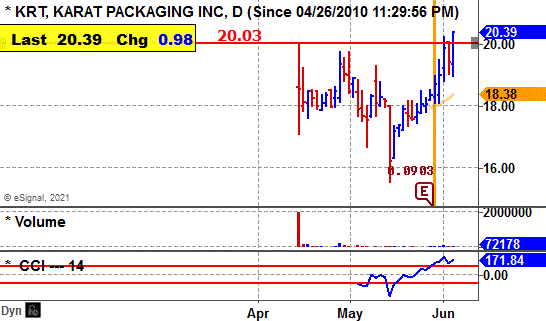
TTD's Quality Rating of Stock - KRT - ABOVE AVERAGE |
|
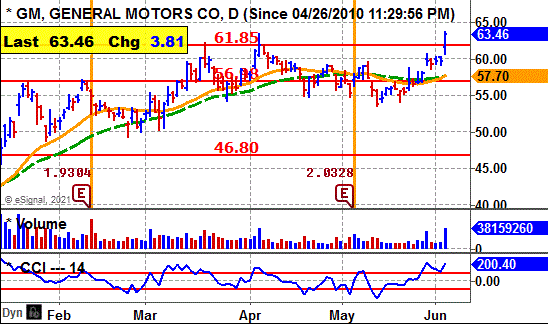
TTD's Quality Rating of Stock - GM - AVERAGE |
|
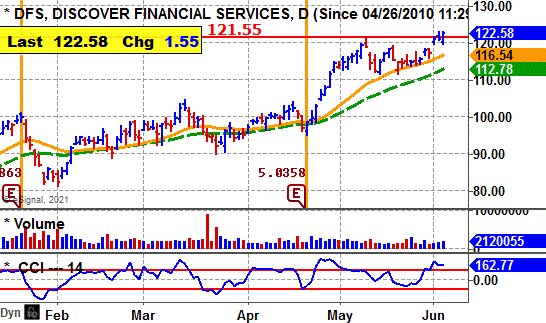
TTD's Quality Rating of Stock - DFS - AVERAGE |

Ticker Tape DigestÆs Daily List of ōStocks To Sell or Sell Shortö ranks stocks well timed to be sold immediately based on daily trading. The list can be used as an alert to reduce current long-term positions.
Shorts from tape action - 4
Stocks Screened - 12,234
Long-Term Environment for bears: Unfavorable.
Bear Side - Small list of shorts. Bears should be conservative.
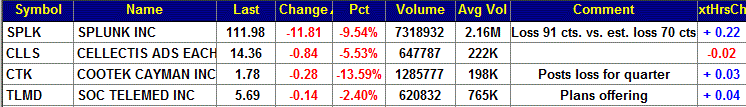
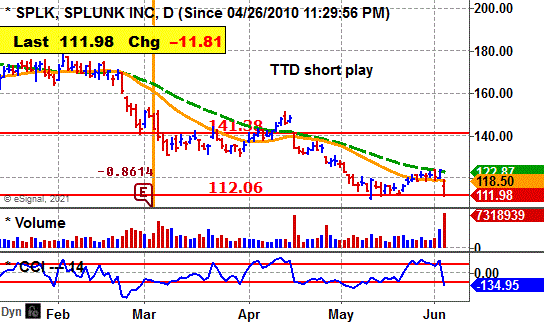
SPLK, based in San Francisco, develops software programs that monitor and analyze data. Annual revenues: $2.2 billion. SPLK's stock falls sharply Thursday after reporting a wider than expected loss. 
So far today, SPLK is trading 7.3 million shares, triple its average daily volume of 2.2 million shares.
TTD sees more on the downside.
The company reported a loss of 91 cents a share for the fiscal first quarter ended in April of 91 cents a share.
That was more than the Street estimate of a loss of 70 cents a share.
SPLK fell sharply in the morning down to $112.82. It rallied around noon to $114. 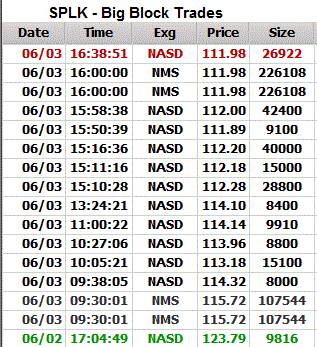
However, in the afternoon, the stock trended lower. It closed near its low for the day.
In after-hours trading, SPLK was up 2 cents a share.
Tape Action
SPLK's tape action shows the recent block trades.
One can see the price for the blocks falling from $123.79 in the prior session to as low as $111.89 late in the day.
A key bearish trade came in the morning when a block of 107,544 shares (duplicated) crossed the tape at $115.72.
That was down from the prior block at $123,79 on 9,816 shares in the prior session.
Business
SPLK produces software to collect, index, search, explore, monitor and analyze data.
Its offerings address diverse data sets that are referred to as big data and are specifically used for machine data.
Machine data is produced by various software and electronic devices in an organization and contains a definitive, time-stamped record of various activities, such as transactions, customer and user activities and security threats.
The company offers Splunk Enterprise, a machine data platform..
Earnings:
This fiscal year ending in January of 2022, the Street predicts a loss of 80 cents a share compared with a loss of 55 cents the prior year.
Going out to fiscal 2023 ending in January, they expect a loss of 4 cents a share.
Charts:
SPLK's daily chart shows the stock trending down from $180 to $111 in recent months.
The stock tried to rally recently but has since rolled over again with a big pick up in volume. That is very bearish.
Strategy Opinion: TTD is targeting SPLK for a decline to $98 within the next few months, or sooner. A protective stop buy can be placed near $116.
Suitability: Aggressive Bears.
TTD's Stock Probability research of Prior Performance:
|
Response to Net |
Bullish |
SPLK rose 9 times after 15 earnings reports. |
|
Seasonal Success |
Bullish |
SPLK fell avg 1.6% in June, rose 3.8% in July prior years. |
|
Earnings Beats |
Bullish |
SPLK beat Street estimate 15 times after 19 reports. |
|
TTD's Quality Rating of Stock - SPLK - BELOW AVERAGE |
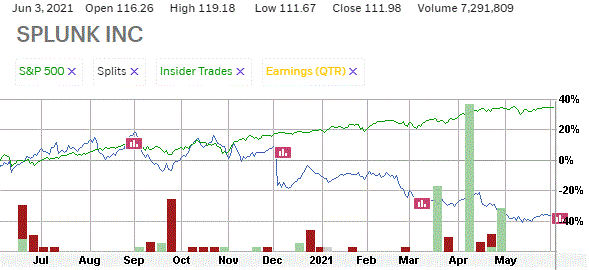
Stock's Performance Chart with Quarterly Earnings Markers vs. S&P 500
Insider Buying in Green - Insider Selling in Red
TTD columnist Leo Fasciocco has covered the stock market for over 30 years. His articles appear in many publications. He has also been a speaker at the Money Show conferences. He has been on television and radio. He is author of many educational articles about stock investing and the book ōGuide To High-Performance Investing.ö

For information to subscribe to the Ticker Tape Digest Services call: Beverly Owen at 1-480-704-3331.
Distributed by Corona Publishing Enterprises. TickerTape Digest Inc. 1220 W. Sherri, Gilbert, Az. 85233.
TTD ōProfessional Reportö is available on the Web: $100 per month. Password needed. Published daily - around 20 times a month.
TTD Pro Report includes a Morning chart slide show of breakout stocks, a Midsession video-audio show with commentary on breakout stocks and shorts and a Final end of day overall report on breakout stocks for the session, short plays and accumulation plays. There are other features too such as Quick Trades and Long-term Plays.
TTD Daily Report is $39. It covers a Morning slide show of charts of stocks breaking out and a TTD end of day print report covering breakout stocks and shorts.
Credit cards accepted. Payable to Corona Publishing Enterprises.
(The information contained has been prepared from data deemed reliable but there is no guarantee of complete accuracy. Ticker Tape Digest Inc. is not affiliated with any broker, dealer or investment advisor. Nothing in this publication constitutes an offer, recommendation or solicitation to buy or sell any securities. Further research is advised. This report is copyrighted and no redistribution is permitted with out permission.)