![]()
|
|
|
Go to Video Show - "How to Make Money With Breakout Stocks |
|---|

By Leo Fasciocco -- TTD
Ticker Tape Digest presents its daily stock market report containing stocks to go long as Breakout Trades, Quick Trades, or Bargain Accumulation Trades.
We also feature stocks under Significant Accumulation that are poised to breakout.
|
Ticker Tape Digest's Daily schedule guide for TTD subscribers 1. Pre-market - check Breakout Watch List and Quick Trades. 2. Morning - (11:30 - 12 A.M.) - check breakout stocks tape and breakout chart slide show. 3. Midday (1 P.M.) check TTD Midsession Report and see market video show. 4. After close (4 P.M.) check final TTD Report for day. Trading Strategies Bullish Aggressive Investors Bullish - "Breakout Stocks" - ideally suited for bull markets and special situation stocks. Potential for large returns. (See Performance) Aggressive Investor Bullish- "Quick Trade Stocks" -ideally suited for entry into top performing issues looking for a small quick profit." (See Performance) Conservative Investors "Bargain Buy Trades for the Long Term." Ideally suited for entry into top performing big cap stocks on pullbacks within overall up trend.(See Performance) Bearish Aggressive Bearish Investors - "Breakdown Stocks" to Sell Short. Ideally suited for bear markets or market pull backs. Potential for large returns (See Performance) |
|---|
The TTD report also contains stocks to short as breakdown plays and as bargain (swing trade) shorts.
Investors should tend to try to go with a strategy that fits with the stock market's trend, unless there is a special situation play.
TTD's Breakout Stocks - Long are
most suitable for aggressive investors seeking ideal entry points into leading stocks, especially during bull markets. They can do extremely well in bull markets with gains of as much as several hundred percent. 
These stocks can also do extremely well during strong market rallies, or if they are in a industry group that is performing very well. They tend to have strong earnings outlooks and are near new-52 week, or all-time highs.
TTD Swng - Quick Trade Stocks - Long These are leading issues that have pulled back in recent days, but could move higher soon. They are most suitable for Aggressive Investors willing to trade short term. These stocks will do extremely well during market advances. They have about 74% win rate. During market rally sequences the win rate is even higher. The return is small 3% to 8% in just a few days.
TTD also presents Stocks To Sell or Sell Short. These issues are suitable for aggressive investors willing to take short positions both as trades or for longer-term plays. These stocks will do very well during bear markets or market pull backs.
TTD's Bearish breakdown stocks to sell short. These issues have potential to fall sharply. They often show a technical breakdown and also some fundamental business problem such as weak earnings.
TTD's multi-media updates include a slide-show that presents charts and analysis at midsession. Some times TTD presents feature analysis on stocks and the market. TTD uses Windows Media Files. (WMV).
TTD also presents a "Breakout Watch List" that is up dated daily. This list consists of key stocks in position to breakout. A close watch of this list can put you in the stock just as it breaks out. A good idea is to study the list and be ready to move into a stock quickly as it hits its breakpoint.
TTD often suggests using stop buy orders to enter. It is very important to buy a breakout stock as close as possible to the breakpoint. The idea is to get "elbow room" if the stock should follow through to the upside. This is very important in being successful in making big money with breakout stocks.
It is also essential to have a stop loss strategy for all stocks in which positions are taken. Not every stock will work as expected. It is important for investors to "police" their portfolios and avoid getting trapped in any bad positions.
Quality rating of breakout Two key factors: 1 - Stock near all-time high in price or near a 52-week high. 2 - earnings growth current year is strong. The ideal play is a stock with an Above Average Quality Rating. The stock is near a new high and will have strong earnings. TTD's other ratings are Average and Below Average.
TTD also has special feature sections on Educational Tips on Investing.
To email Mr. Leo Fasciocco leo@tickertapedigest.com.
For service, email Beverly Owen owen@tickertapedigest.com. TTDÆs Tel: 1-480-878-8381 or 480-704-3331.
Friday - June 25, 2021
TTD's Breakout Stocks
Stock Market Overview
Total Buy Breakouts - 14
Quality of Breakouts - Above Average.
Stocks Screened - 12,234
Bull side - Large list of breakouts with some interesting plays for aggressive bulls.
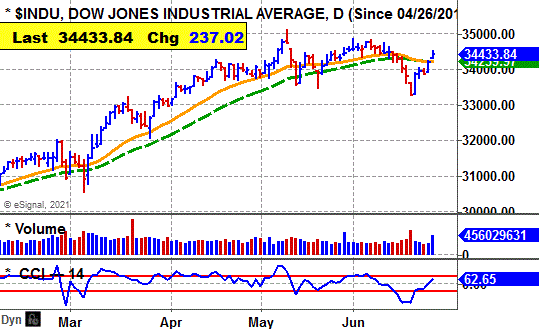
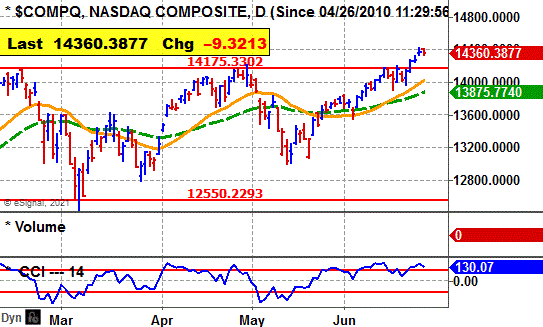
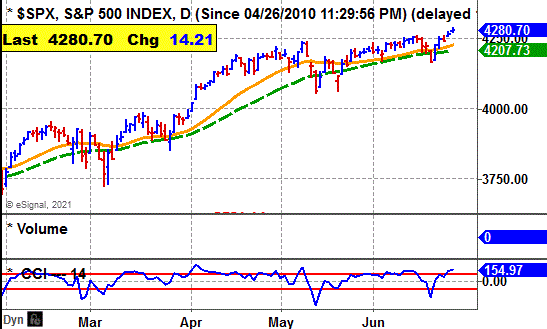
Stock market - Major averages bullish in all time zones. Dow rallies to turne bullish again.
Comment - Large list of breakouts. Bulls can be venturesome.
See Latest Earnings Reports - A company that tops the Street's highest earnings estimate has potential to go higher. Key earnings beats - KMX, PAYX, APOG and JKS.
Stock Market Momentum
(Daily is based on a moving average)
|
Market (Daily) |
Market (Weekly) |
Market (Monthly) |
|
Dow - Bullish |
Dow - Bullish |
Dow - Bullish |
|
Nasdaq - Bullish |
Nasdaq - Bullish |
Nasdaq - Bullish |
|
S&P 500 - Bullish |
S&P 500 - Bullish |
S&P 500 - Bullish |
 Ticker Tape Digest's
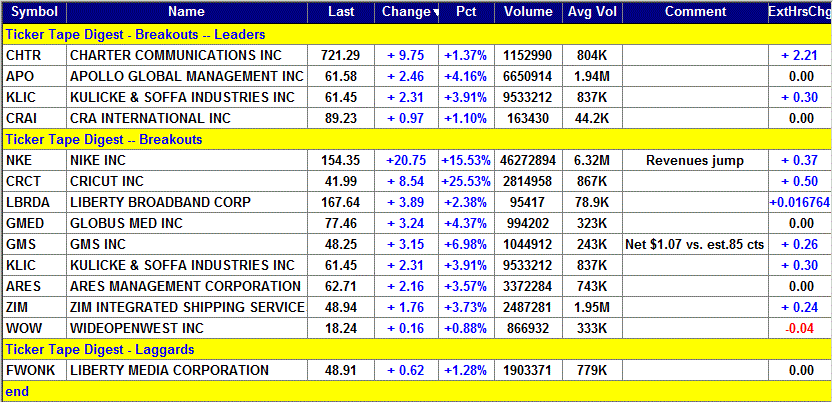
|
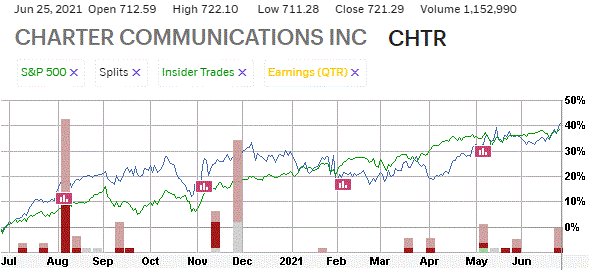
TTD's Quality Rating of Stock - CHTR - ABOVE AVERAGE |
CHTR, based in Stamford, Ct., is a cable operator in the U.S. and a broadband communications services company. Annual revenues: $48.1 billion. CHTR's stock moves higher Friday and breaks out from its 7-week, cup-and-handle base.
So far today, CHTR is trading a heavy 1.2 million shares. Its average daily volume is 804,000 shares.
TTD sees CHTR with good chances to work higher off the breakout. 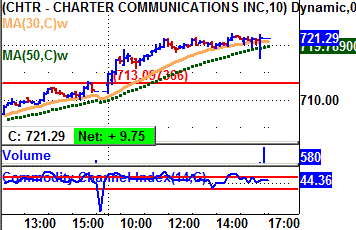
CHTR rose in the morning and cleared its breakpoint line.
The stock reached $721.29 late in the morning.
It then trended mostly sideways the rest of the day holding easily above its breakpoint line.
In after-hours trading, CHTR was up $2.21 a shares.
Tape Action
CHTR's tape action shows the recent block trades.
One can see the price for the blocks climbing from $711.54 in the prior session to as high as $721.44 late in the day.
A key bullish trade came in the morning when a block of 11,874 shares crossed the tape at $712.59.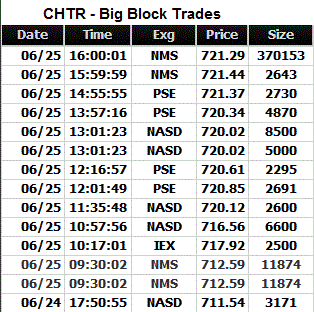
That was up from the prior block at $711.54 on 3,171 shares.
Near the close a massive block of 370,153 shares crossed at $721.29.
That was down from the prior trade in the sequence at $721.30 on 154 shares.
Business
The company provides video, Internet and voice services to some 26.2 million residential and business customers.
In addition, it sells video and online advertising to local, regional and national advertising customers and fiber-delivered communications and managed information technology.
The company also owns and operates regional sports networks and local sports, news and lifestyle channels and sells security and home management services to the residential marketplace.
Charts
CHTR's 12-month performance chart shows the stock up 41% versus a 35% gain for the stock market.
Insiders were recent buyers using stock options $175 to $691 a share. They were sellers at $629 to $685 a share.
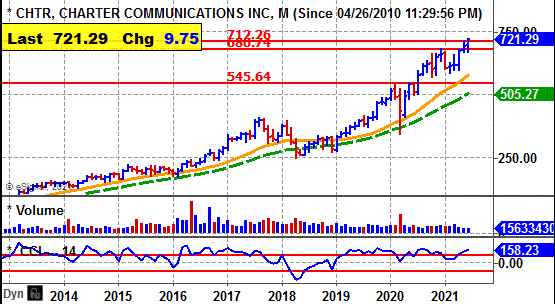
CHTR's long-term chart shows the stock climbing from $135 in 2014 to a peak at $408 in 2017.
The stock went into a long-term base. It broke out at $400 in 2019. The stock then ran up to $721 this year. 
CHTR's daily chart shows the stock in a cup-and-handle base.
The breakout comes with good volume.
CHTR had been bumping up against the resistance area for a few sessions.
CHTR's CCI momentum indicator is strongly bullish.
Earnings Outlook
This year, analysts forecast a 29% jump in net to $19.86 a share from the $15.40 the year before.
The stock has a price-earnings ratio of 36. That is high, but okay given the earnings growth rate.
Looking out to 2021, the Street predicts a 38% leap in net to $27.40 versus the anticipated $19.86 this year.
Quarterly earnings growth will be strong.
Net for the upcoming second quarter should leap 34% to $4.88 a share from the $3.63 the prior year.
The highest estimate on the Street is at $4.49 a share. The company topped the Street the past three out of four quarters.
Profits for the third quarter should rise 28% to $5.01 a share from the $3.90 the prior year.
Strategy Opinion: TTD is targeting CHTR for a move to $820 within the next few months, or sooner. A protective stop can be placed near $705.
Intermediate-Term Rating: Above Average.
Suitability: Aggressive Bulls.
TTD's special research of Stock's Prior Performance:
|
Breakout Success |
Bullish |
CHTR scored modest gains off recent breakouts. |
|
Response to Net |
Bullish |
CHTR rose 13 times after 15 earnings reports. |
|
Seasonal Success |
Bullish |
CHTR avg. gain 7.9% in July, 4% in August prior years. |
|
Earnings Beats |
Bullish |
CHTR beat Street net estimate 11 times after 19 reports. |
Stock's Prior Performance After A Breakout
|
Stock's % Change from Breakout to peak - prior to cut below 50-day M/A. |
Date of Breakout |
Break point Price |
Stocks Price Peak after Breakout - prior to cut below 50-day M/A |
Date Trade Closed |
|
18% |
7/16/2020 | 551 | 651 | 10/12/2020 |
|
6% |
1/2/2020 | 486 | 515.40 | 1/15/2020 |
|
12% |
10/15/2019 | 429.15 | 479.08 | 11/20/2019 |
|
13% |
5/31/2019 | 367.76 | 414.84 | 7/16/2019 |
|
10% |
7/28/2017 | 355.26 | 389.75 | 8/8/2017 |
| 13% | 8/8/2016 | 242.53 | 274.67 | 9/6/2016 |
(In actual trading, entry and exit points could vary depending on broker execution.
Also, ideal are breakouts to a new 52-week high or better, perhaps all-time highs.)
Stock's Long-term Chart
Stock's Price Performance after Reporting Earnings
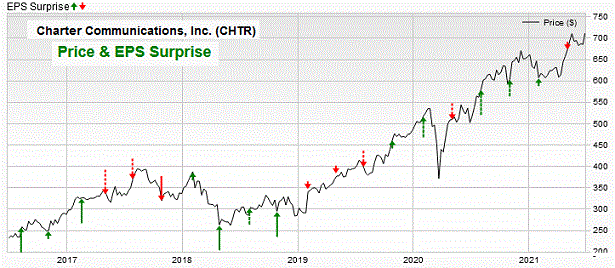
Stock's Performance Chart with Quarterly Earnings Markers vs. S&P 500
Insider Buying in Green - Insider Selling in Red
Charts of Selected Breakout Stocks
|
TTD's Quality Rating of Stock - APO - ABOVE AVERAGE |

|
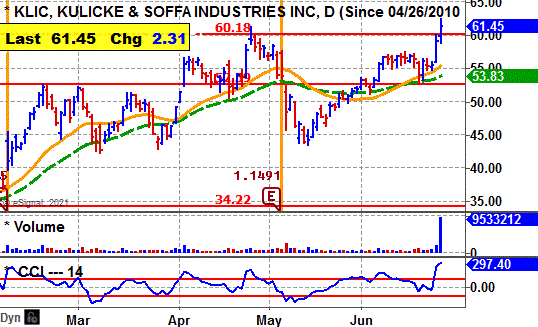
TTD's Quality Rating of Stock - KLIC - ABOVE AVERAGE |
|
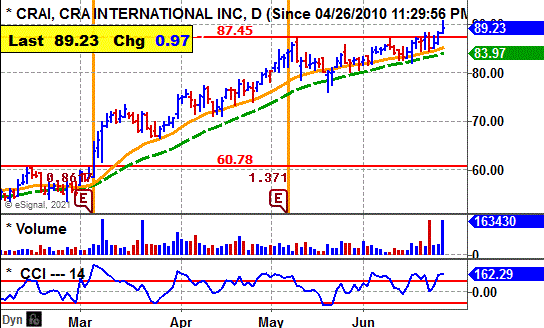
TTD's Quality Rating of Stock - CRAI - ABOVE AVERAGE |
|
TTD's Quality Rating of Stock - NKE - AVERAGE |


Ticker Tape DigestÆs Daily List of ōStocks To Sell or Sell Shortö ranks stocks well timed to be sold immediately based on daily trading. The list can be used as an alert to reduce current long-term positions.
Shorts from tape action - 1
Stocks Screened - 12,234
Long-Term Environment for bears: unfavorable.
Bear Side - Only one short play. Bears remain conservative.
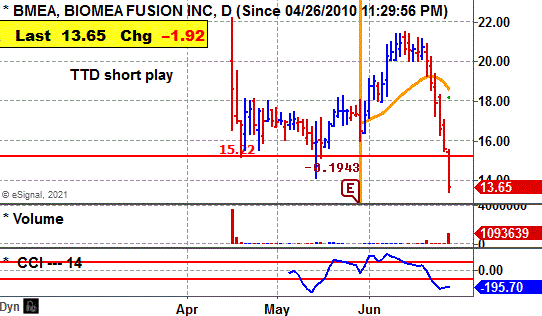
![]()
BMEA, based in Redwood City, Ca., is a biotech firm working on treatments for cancer. Annual revenues: Nil. BMEA's stock falls sharply Friday and undercuts recent technical support. 
So far today, BMEA is trading a heavy 1.1 million shares, ten times its average daily volumeof 100,000 shares.
In after-hours trading, BMEA was up $1.11 a share.
Nevertheless, TTD sees more on the downside. 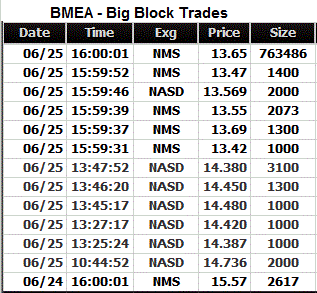
BMEA's stock moved lower in the morning and undercut key support.
It touched $14.04 around noon and then lifted slightly to $14.54.
However, BMEA then rolled over and fell to $13.65.
Tape Action
BMEA's tape action shows the recent block trades.
One can see the price for the blocks falling from $15.57 in the prior session to as low as $13.42 late in the day.
A key bearish trade came in the morning when a block of 2,000 shares crossed at $14.73.
That was down from the prior block at $15.57 on 2,617 shares the day before.
Near the close a massive block of 763,486 shares crossed at $13.65.
That came on an up tick from the prior trade at $13.46 on 100 shares.
Business
BMEA is working on the development of a drugs to treat patients with genetically defined cancers.
The company has built FUSION System discovery platform to advance a pipeline of irreversible small molecule product candidates.
BMEA's lead product candidate, BMF-219, is designed to be an orally bioavailable, potent and selective irreversible inhibitor of menin, an important transcriptional regulator known to play a direct role in oncogenic signaling in multiple cancers.
Earnings:
This year, analysts predict a loss of $1.17 a share. There was no comparable results from the prior year.
Looking out to 2022, the Street projects a loss of $1.88 a share.
For the second quarter a loss of 22 cents a share is projected
Charts:
BMEA's daily chart shows the stock breaking out from a base at $18 back in early June. The stock ran up to a peak at $21.48. However, since then BMEA has fallen sharply. It is now at an all-time low.
Strategy Opinion: TTD is targeting BMEA for a decline to $10.50 within the next few months, or sooner. A protective stop buy can be placed near $14.40.
Suitability: Aggressive Bears.
TTD's Stock Probability research of Prior Performance:
|
Response to Net |
Bearish |
BMEA fell one time after one earnings reports. |
|
Seasonal Success |
Bearish |
BMEA loss avg 21% in June. |
|
TTD's Quality Rating of Stock - BMEA - BELOW AVERAGE |
Stock's Performance Chart with Quarterly Earnings Markers vs. S&P 500
Insider Buying in Green - Insider Selling in Red

TTD columnist Leo Fasciocco has covered the stock market for over 30 years. His articles appear in many publications. He has also been a speaker at the Money Show conferences. He has been on television and radio. He is author of many educational articles about stock investing and the book ōGuide To High-Performance Investing.ö

For information to subscribe to the Ticker Tape Digest Services call: Beverly Owen at 1-480-704-3331.
Distributed by Corona Publishing Enterprises. TickerTape Digest Inc. 1220 W. Sherri, Gilbert, Az. 85233.
TTD ōProfessional Reportö is available on the Web: $100 per month. Password needed. Published daily - around 20 times a month.
TTD Pro Report includes a Morning chart slide show of breakout stocks, a Midsession video-audio show with commentary on breakout stocks and shorts and a Final end of day overall report on breakout stocks for the session, short plays and accumulation plays. There are other features too such as Quick Trades and Long-term Plays.
TTD Daily Report is $39. It covers a Morning slide show of charts of stocks breaking out and a TTD end of day print report covering breakout stocks and shorts.
Credit cards accepted. Payable to Corona Publishing Enterprises.
(The information contained has been prepared from data deemed reliable but there is no guarantee of complete accuracy. Ticker Tape Digest Inc. is not affiliated with any broker, dealer or investment advisor. Nothing in this publication constitutes an offer, recommendation or solicitation to buy or sell any securities. Further research is advised. This report is copyrighted and no redistribution is permitted with out permission.)