![]()
|
|
|
Go to Video Show - "How to Make Money With Breakout Stocks |
|---|

By Leo Fasciocco -- TTD
Ticker Tape Digest presents its daily stock market report containing stocks to go long as Breakout Trades, Quick Trades, or Bargain Accumulation Trades.
We also feature stocks under Significant Accumulation that are poised to breakout.
|
Ticker Tape Digest's Daily schedule guide for TTD subscribers 1. Pre-market - check Breakout Watch List and Quick Trades. 2. Morning - (11:30 - 12 A.M.) - check breakout stocks tape and breakout chart slide show. 3. Midday (1 P.M.) check TTD Midsession Report and see market video show. 4. After close (4 P.M.) check final TTD Report for day. Trading Strategies Bullish Aggressive Investors Bullish - "Breakout Stocks" - ideally suited for bull markets and special situation stocks. Potential for large returns. (See Performance) Aggressive Investor Bullish- "Quick Trade Stocks" -ideally suited for entry into top performing issues looking for a small quick profit." (See Performance) Conservative Investors "Bargain Buy Trades for the Long Term." Ideally suited for entry into top performing big cap stocks on pullbacks within overall up trend.(See Performance) Bearish Aggressive Bearish Investors - "Breakdown Stocks" to Sell Short. Ideally suited for bear markets or market pull backs. Potential for large returns (See Performance) |
|---|
The TTD report also contains stocks to short as breakdown plays and as bargain (swing trade) shorts.
Investors should tend to try to go with a strategy that fits with the stock market's trend, unless there is a special situation play.
TTD's Breakout Stocks - Long are
most suitable for aggressive investors seeking ideal entry points into leading stocks, especially during bull markets. They can do extremely well in bull markets with gains of as much as several hundred percent. 
These stocks can also do extremely well during strong market rallies, or if they are in a industry group that is performing very well. They tend to have strong earnings outlooks and are near new-52 week, or all-time highs.
TTD Swng - Quick Trade Stocks - Long These are leading issues that have pulled back in recent days, but could move higher soon. They are most suitable for Aggressive Investors willing to trade short term. These stocks will do extremely well during market advances. They have about 74% win rate. During market rally sequences the win rate is even higher. The return is small 3% to 8% in just a few days.
TTD also presents Stocks To Sell or Sell Short. These issues are suitable for aggressive investors willing to take short positions both as trades or for longer-term plays. These stocks will do very well during bear markets or market pull backs.
TTD's Bearish breakdown stocks to sell short. These issues have potential to fall sharply. They often show a technical breakdown and also some fundamental business problem such as weak earnings.
TTD's multi-media updates include a slide-show that presents charts and analysis at midsession. Some times TTD presents feature analysis on stocks and the market. TTD uses Windows Media Files. (WMV).
TTD also presents a "Breakout Watch List" that is up dated daily. This list consists of key stocks in position to breakout. A close watch of this list can put you in the stock just as it breaks out. A good idea is to study the list and be ready to move into a stock quickly as it hits its breakpoint.
TTD often suggests using stop buy orders to enter. It is very important to buy a breakout stock as close as possible to the breakpoint. The idea is to get "elbow room" if the stock should follow through to the upside. This is very important in being successful in making big money with breakout stocks.
It is also essential to have a stop loss strategy for all stocks in which positions are taken. Not every stock will work as expected. It is important for investors to "police" their portfolios and avoid getting trapped in any bad positions.
Quality rating of breakout Two key factors: 1 - Stock near all-time high in price or near a 52-week high. 2 - earnings growth current year is strong. The ideal play is a stock with an Above Average Quality Rating. The stock is near a new high and will have strong earnings. TTD's other ratings are Average and Below Average.
TTD also has special feature sections on Educational Tips on Investing.
To email Mr. Leo Fasciocco leo@tickertapedigest.com.
For service, email Beverly Owen owen@tickertapedigest.com. TTDÆs Tel: 1-480-878-8381 or 480-704-3331.
Wednesday - July 28, 2021
TTD's Breakout Stocks
Stock Market Overview
Total Buy Breakouts - 9
Quality of Breakouts - Average.
Stocks Screened - 12,234
Bull side - Some good looking breakout plays. Aggressive bulls can be venturesome.
Stock market - Major averages still hold bullish in all time zones.
Comment - Bulls need to be watchful now as earnings will pour in the next two weeks.
See Latest Earnings Reports - A company that tops the Street's highest earnings estimate has potential to go higher. Key earnings beats - TEVA, ISBC, FBC, HESM and LNTH.
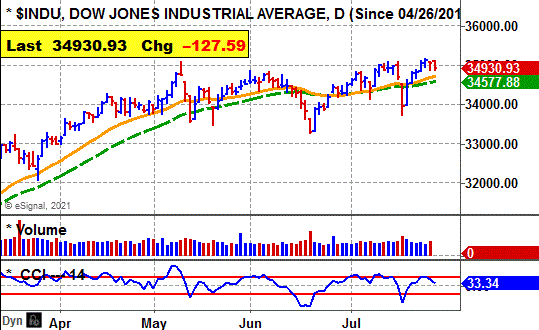
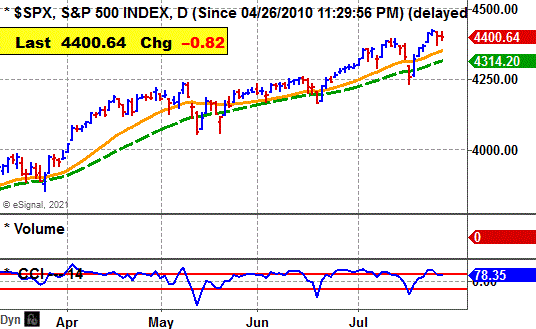
Stock Market Momentum
(Daily is based on a moving average)
|
Market (Daily) |
Market (Weekly) |
Market (Monthly) |
|
Dow - Bullish |
Dow - Bullish |
Dow - Bullish |
|
Nasdaq - Bullish |
Nasdaq - Bullish |
Nasdaq - Bullish |
|
S&P 500 - Bullish |
S&P 500 - Bullish |
S&P 500 - Bullish |

 Ticker Tape Digest's
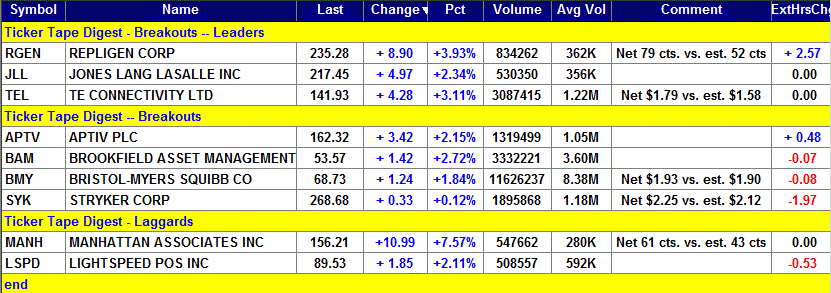
|
TTD's Quality Rating of Stock - RGEN - ABOVE AVERAGE |
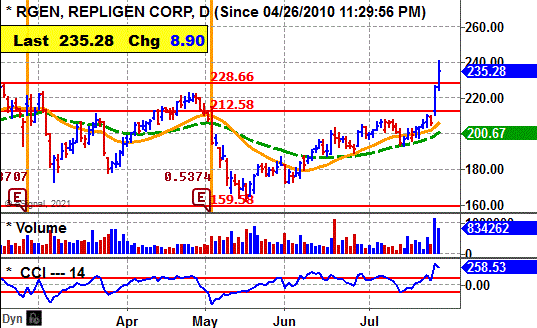
RGEN, based in Waltham, Ma., is a bioprocessing firm for the biological industry. Annual revenues: $366 million. RGEN's stock moves sharply higher Wednesday and breaks out from its six-month, double-bottom base.
So far today, RGEN is trading 834,262 shares, more than double its average daily volume of 362,000 shares.
TTD sees more on the upside.
RGEN's stock moved higher in the morning and cleared its breakpoint.
The stock reached an intraday peak at $240.49 around noon. 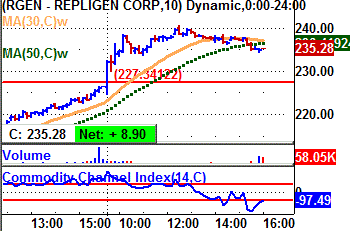
The stock moved sideways in the afternoon, but gave a little ground in the final hour.
Tape Action
RGEN's tape action shows the recent block trades.
One can see the price for the blocks climbing from $226.26 in the morning to as high as $239.52 around noon.
A key bullish trade came in the morning when a block of 2,250 shares crossed at $231.93.
That was up from the prior block at $226.26 on 4,904 shares.
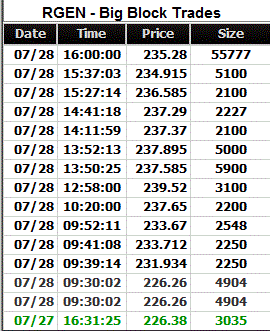 Near the close a big block of 55,777 shares crossed at $235.28.
That was up from the prior block at $234.91 on 5,100 shares.
Business
RGEN makes products used to improve the interconnected phases of the biological drug manufacturing process.
The company's portfolio includes protein products, chromatography products, and filtration products.
It provides Protein A ligands, a component of Protein A chromatography resins used in the purification of virtually all monoclonal antibody (mAb)-based drugs.
IIts filtration products include XCell Alternating Tangential Flow (ATF) Systems and Sius tangential flow filtration (TFF) cassettes.
Sius TFF cassettes are used to concentrate clinical and commercial-stage biologic drugs.
Charts
RGEN's 12-month performance chart shows the stock up 70% versus a 37% rise in the stock market.
Insiders were buyers using stock options at $3.22 to $56.52.
They were sellers at $168 to $205 a share.
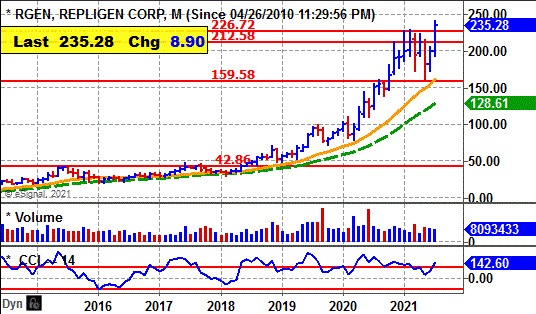
RGEN's long-term chart shows the stock climbing from $26 in 2016 to a peak at $99 by 2019.
 The stock went into a base and broke out in 2020 and has since climbed to $240.
RGEN's daily chart shows the stock moving higher in the prior session.
Then on Wednesday, RGEN pushed higher and cleared its breakpoint line.
The two day move came with strong volume. That is bullish.
The stock's CCI momentum indicator is strongly bullish.
Earnings Outlook
This year, analysts predict a 37% leap in net to $2.26 a share from the $1.65 the prior year.
The stock has a price-earnings ratio of 103. That is high.
Going out to 2022, the Street projects a 14% rise in net to $2.57 a share from the $2.26 this year.
Net for the third quarter should climb 30% to 52 cents a share from the 40 cents the year before.
Then in the fourth quarter net should rise a modest 2% to 53 cents a share from the 52 cents the prior year.
Strategy Opinion: TTD is targeting RGEN for a move to $275 within the next few months, or sooner.
A protective stop can be placed near $227.
Intermediate-Term Rating: Average.
Suitability: Average Bulls.
TTD's special research of Stock's Prior Performance:
|
Breakout Success |
Bullish |
RGEN scored big gains off recent breakouts. |
|
Response to Net |
Bullish |
RGEN rose 11 times after 15 earnings reports. |
|
Seasonal Success |
Bullish |
RGEN avg. gain 5.7% in Aug., loss 8% in Sept. prior years. |
|
Earnings Beats |
Bullish |
RGEN beat Street net estimate 18 times after 20 reports. |
Stock's Prior Performance After A Breakout
|
Stock's % Change from Breakout to peak - prior to cut below 50-day M/A. |
Date of Breakout |
Break point Price |
Stocks Price Peak after Breakout - prior to cut below 50-day M/A |
Date Trade Closed |
|
5% |
1/14/2021 | 212.58 | 222.19 | 1/19/2021 |
|
29% |
10/6/2020 | 159.58 | 206.57 | 11/12/2020 |
|
31% |
4/22/2020 | 107.36 | 140.48 | 5/15/2020 |
|
47% |
4/25/2019 | 61.58 | 90.61 | 8/2/2019 |
(In actual trading, entry and exit points could vary depending on broker execution.
Also, ideal are breakouts to a new 52-week high or better, perhaps all-time highs.)
Stock's Long-term Chart
Stock's Price Performance after Reporting Earnings
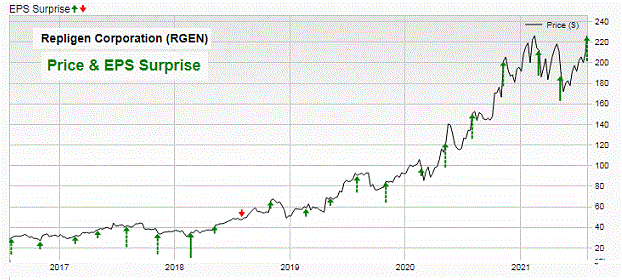
Stock's Performance Chart with Quarterly Earnings Markers vs. S&P 500
Insider Buying in Green - Insider Selling in Red

Charts of Selected Breakout Stocks
|
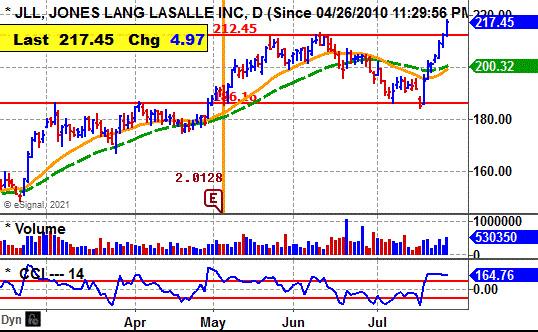
TTD's Quality Rating of Stock - JLL - ABOVE AVERAGE |
|
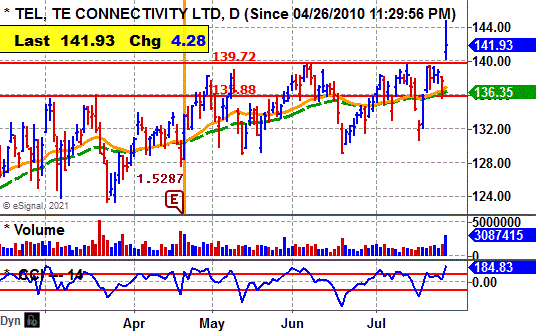
TTD's Quality Rating of Stock - TEL - ABOVE AVERAGE |
|
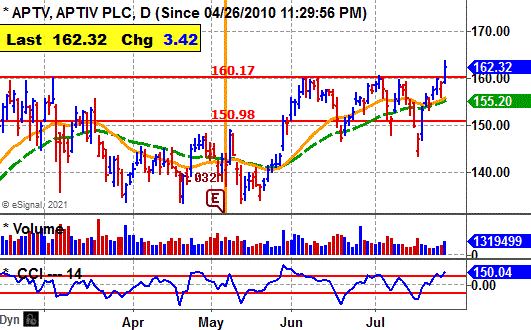
TTD's Quality Rating of Stock - APTV - AVERAGE |
|
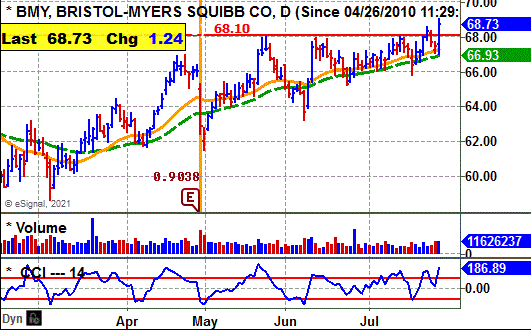
TTD's Quality Rating of Stock - BMY - AVERAGE |

Ticker Tape DigestÆs Daily List of ōStocks To Sell or Sell Shortö ranks stocks well timed to be sold immediately based on daily trading. The list can be used as an alert to reduce current long-term positions.
Shorts from tape action - 2
Stocks Screened - 12,234
Long-Term Environment for bears: Unfavorable.
Bear Side - Just two short plays. Bears be conservative, but watchful.

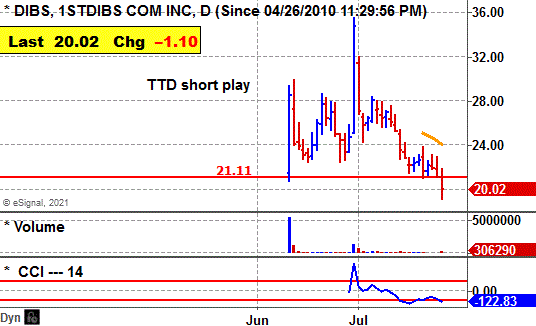
DIBS, based in New York, provides an online market places to buy furniture, fashions and jewelry. Annual revenues: $81.9 billion. DIBS's stock falls Wednesday and undercuts key technical support. 
So far today, DIBS is trading 306,290 shares, more than double its average dally volume of 138,000 shares.
TTD sees potential for more on the downside.
DIBS stock fell in the morning and undercut key support.
The stock touched an intraday low of $19.08 in the morning.
It then lifted back to around $20 and trended sideways the rest of the day. 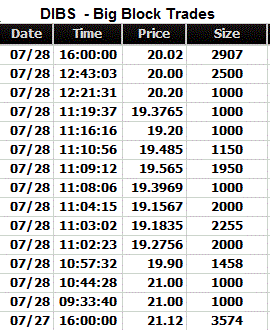
Tape Action
DIBS's tape action shows the recent block trades.
One can see the price for the blocks falling from $21.12 in the prior session to as low as $19.15 in the morning.
A key bearish trade came in the morning when a block of 1,000 shares crossed the tape at $21.
That was down from the prior block the day before at $21.12 on 3,574 shares.
Business
DIBS provides online marketplaces for antique, contemporary furniture, home decor, jewelry, watches, art, and fashion.
The company provides its sellers access to a global community of buyers and a platform to facilitate e-commerce.
Its sellers use its platform to manage their inventory and negotiate orders with buyers.
Earnings:
This year, analysts predict a loss of 90 cents a share. There was no comparable figures from a year before.
Looking to 2022, the Street expects a loss of 96 cents a share.
For the second quarter, analysts predict a loss of 23 cents a share.
Charts:
DIBS's daily chart shows the stock peaking at $35.46 in June. The stock then fell back to around $21. Now, DIBS now breaks below key support and hits a new low.
Strategy Opinion: TTD is targeting DIBS for a decline to $15.50 within the next few months, or sooner. A protective stop buy can be placed near $22.
Suitability: Aggressive Bears.
TTD's Stock Probability research of Prior Performance:
|
Seasonal Success |
Bearish |
DIBS fell 42% in July. |
|
TTD's Quality Rating of Stock - DIBS - BELOW AVERAGE |
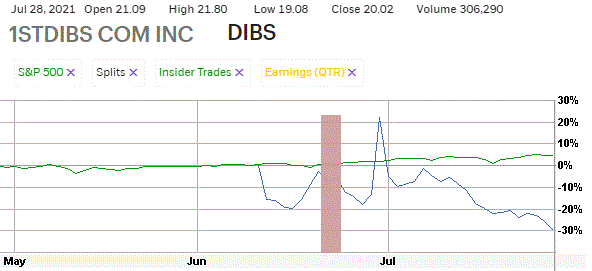
Stock's Performance Chart with Quarterly Earnings Markers vs. S&P 500
Insider Buying in Green - Insider Selling in Red
TTD columnist Leo Fasciocco has covered the stock market for over 30 years. His articles appear in many publications. He has also been a speaker at the Money Show conferences. He has been on television and radio. He is author of many educational articles about stock investing and the book ōGuide To High-Performance Investing.ö

For information to subscribe to the Ticker Tape Digest Services call: Beverly Owen at 1-480-704-3331.
Distributed by Corona Publishing Enterprises. TickerTape Digest Inc. 1220 W. Sherri, Gilbert, Az. 85233.
TTD ōProfessional Reportö is available on the Web: $100 per month. Password needed. Published daily - around 20 times a month.
TTD Pro Report includes a Morning chart slide show of breakout stocks, a Midsession video-audio show with commentary on breakout stocks and shorts and a Final end of day overall report on breakout stocks for the session, short plays and accumulation plays. There are other features too such as Quick Trades and Long-term Plays.
TTD Daily Report is $39. It covers a Morning slide show of charts of stocks breaking out and a TTD end of day print report covering breakout stocks and shorts.
Credit cards accepted. Payable to Corona Publishing Enterprises.
(The information contained has been prepared from data deemed reliable but there is no guarantee of complete accuracy. Ticker Tape Digest Inc. is not affiliated with any broker, dealer or investment advisor. Nothing in this publication constitutes an offer, recommendation or solicitation to buy or sell any securities. Further research is advised. This report is copyrighted and no redistribution is permitted with out permission.)