![]()
|
|
|
Go to Video Show - "How to Make Money With Breakout Stocks |
|---|

By Leo Fasciocco -- TTD
Ticker Tape Digest presents its daily stock market report containing stocks to go long as Breakout Trades, Quick Trades, or Bargain Accumulation Trades.
We also feature stocks under Significant Accumulation that are poised to breakout.
|
Ticker Tape Digest's Daily schedule guide for TTD subscribers 1. Pre-market - check Breakout Watch List and Quick Trades. 2. Morning - (11:30 - 12 A.M.) - check breakout stocks tape and breakout chart slide show. 3. Midday (1 P.M.) check TTD Midsession Report and see market video show. 4. After close (4 P.M.) check final TTD Report for day. Trading Strategies Bullish Aggressive Investors Bullish - "Breakout Stocks" - ideally suited for bull markets and special situation stocks. Potential for large returns. (See Performance) Aggressive Investor Bullish- "Quick Trade Stocks" -ideally suited for entry into top performing issues looking for a small quick profit." (See Performance) Conservative Investors "Bargain Buy Trades for the Long Term." Ideally suited for entry into top performing big cap stocks on pullbacks within overall up trend.(See Performance) Bearish Aggressive Bearish Investors - "Breakdown Stocks" to Sell Short. Ideally suited for bear markets or market pull backs. Potential for large returns (See Performance) |
|---|
The TTD report also contains stocks to short as breakdown plays and as bargain (swing trade) shorts.
Investors should tend to try to go with a strategy that fits with the stock market's trend, unless there is a special situation play.
TTD's Breakout Stocks - Long are
most suitable for aggressive investors seeking ideal entry points into leading stocks, especially during bull markets. They can do extremely well in bull markets with gains of as much as several hundred percent. 
These stocks can also do extremely well during strong market rallies, or if they are in a industry group that is performing very well. They tend to have strong earnings outlooks and are near new-52 week, or all-time highs.
TTD Swng - Quick Trade Stocks - Long These are leading issues that have pulled back in recent days, but could move higher soon. They are most suitable for Aggressive Investors willing to trade short term. These stocks will do extremely well during market advances. They have about 74% win rate. During market rally sequences the win rate is even higher. The return is small 3% to 8% in just a few days.
TTD also presents Stocks To Sell or Sell Short. These issues are suitable for aggressive investors willing to take short positions both as trades or for longer-term plays. These stocks will do very well during bear markets or market pull backs.
TTD's Bearish breakdown stocks to sell short. These issues have potential to fall sharply. They often show a technical breakdown and also some fundamental business problem such as weak earnings.
TTD's multi-media updates include a slide-show that presents charts and analysis at midsession. Some times TTD presents feature analysis on stocks and the market. TTD uses Windows Media Files. (WMV).
TTD also presents a "Breakout Watch List" that is up dated daily. This list consists of key stocks in position to breakout. A close watch of this list can put you in the stock just as it breaks out. A good idea is to study the list and be ready to move into a stock quickly as it hits its breakpoint.
TTD often suggests using stop buy orders to enter. It is very important to buy a breakout stock as close as possible to the breakpoint. The idea is to get "elbow room" if the stock should follow through to the upside. This is very important in being successful in making big money with breakout stocks.
It is also essential to have a stop loss strategy for all stocks in which positions are taken. Not every stock will work as expected. It is important for investors to "police" their portfolios and avoid getting trapped in any bad positions.
Quality rating of breakout Two key factors: 1 - Stock near all-time high in price or near a 52-week high. 2 - earnings growth current year is strong. The ideal play is a stock with an Above Average Quality Rating. The stock is near a new high and will have strong earnings. TTD's other ratings are Average and Below Average.
TTD also has special feature sections on Educational Tips on Investing.
To email Mr. Leo Fasciocco leo@tickertapedigest.com.
For service, email Beverly Owen owen@tickertapedigest.com. TTDÆs Tel: 1-480-878-8381 or 480-704-3331.
Friday - July 30, 2021
TTD's Breakout Stocks
Stock Market Overview
Total Buy Breakouts - 14
Quality of Breakouts - Above average.
Stocks Screened - 12,234
Bull side - Large list of breakouts with some good looking plays.
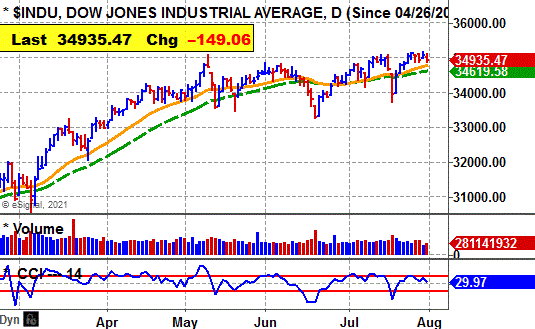
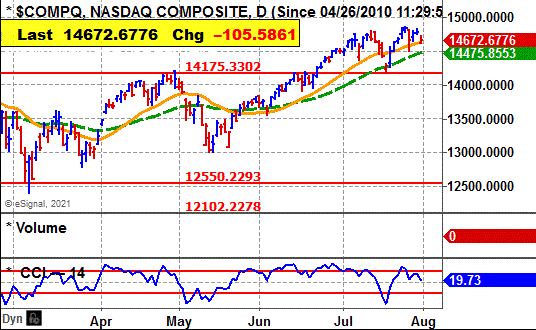
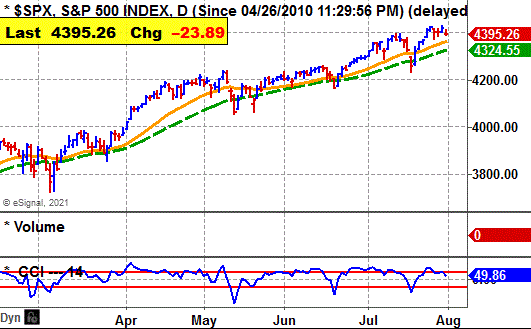
Stock market - Major averages remain bullish in all time zones, even though the market fell on Friday.
Comment - Aggressive bulls can be venturesome.
See Latest Earnings Reports - A company that tops the Street's highest earnings estimate has potential to go higher. Key earnings beats - CPRI, QSR, CHTR, DNZOY and LAZ.
Stock Market Momentum
(Daily is based on a moving average)
|
Market (Daily) |
Market (Weekly) |
Market (Monthly) |
|
Dow - Bullish |
Dow - Bullish |
Dow - Bullish |
|
Nasdaq - Bullish |
Nasdaq - Bullish |
Nasdaq - Bullish |
|
S&P 500 - Bullish |
S&P 500 - Bullish |
S&P 500 - Bullish |
 Ticker Tape Digest's
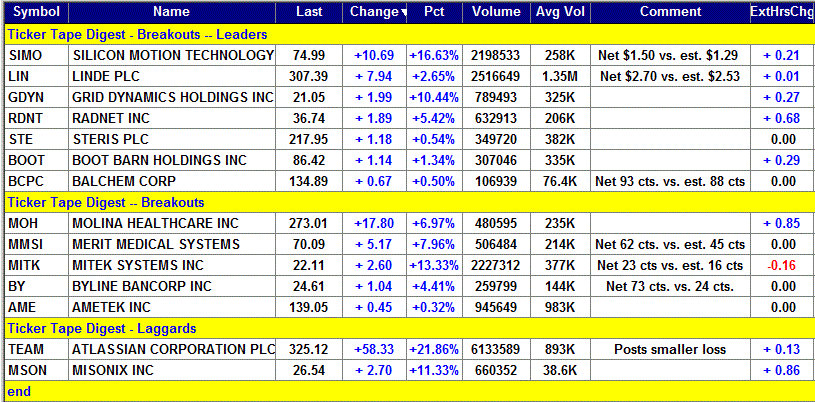
|
TTD's Quality Rating of Stock - GDYN - ABOVE AVERAGE |
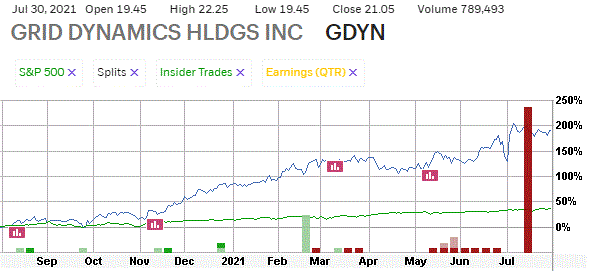
GDYN, based in La Jolla, Ca., provides digital and consulting services. Annual revenues: $111.3 million. GDYN's stock moves sharply higher Friday and breaks out from its 5-week, flat base. 
So far today, GDYN is trading a heavy 789,493 shares, double its average daily volume of 325,000 shares.
TTD sees more on the upside as GDYN hits a new al-time high. 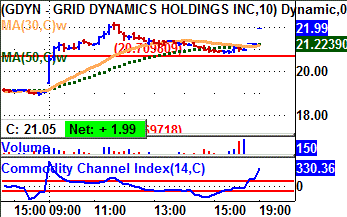
TTD highlighted GDYN as a breakout at our midsession video show on the Web Friday.
GDYN's tock moved higher in the morning and cleared its breakpoint line.
The stock reached an intraday high of $22.25.
The stock then pulled back slightly and trended sideways the rest of the day.
In after-hours trading, the stock was up 27 cents a share. 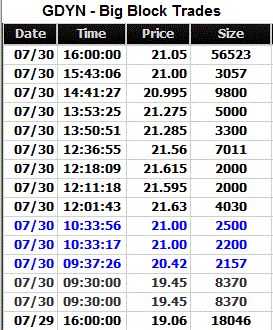
Tape Action
GDYN's tape action shows the recent block trades.
One can see the price for the blocks rising from $19.06 in the prior session to as high as $21.63 by noon.
A key bullish trade came in the morning when a block of 8,370 shares crossed the tape at $19.45.
That was up from the prior block at $19.06 on 18,046 shares.
Near the close a big block of 56,523 shares crossed at $21.05.
That was up from the prior block at $21 on 3,057 shares.
Business
GDYN provides digital transformation initiatives, which include consulting, development of prototypes and enterprise-scale delivery of digital platforms.
The company focuses on software design, testing and Internet service operations.
GDYN delivers tailored solutions in industries such as retail, technology, consumer packaged goods and finance.
Charts
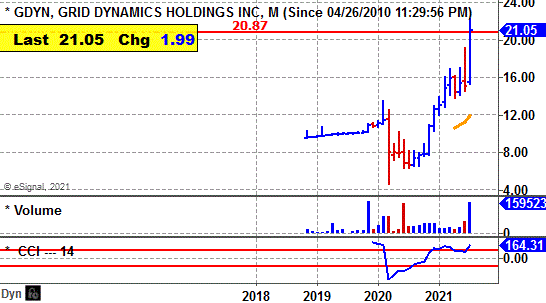
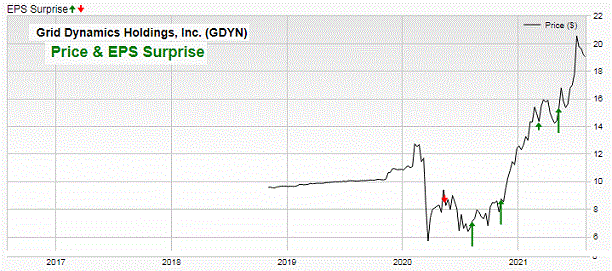
GDYN's 12-month performance chart shows the stock up 210% versus a 36% gain for the stock market.
Insiders were recent buyers at $3.54. They also bought in the open market at $8.47 to $11.71 a share.
They were sellers at $13.55 to $20.44.
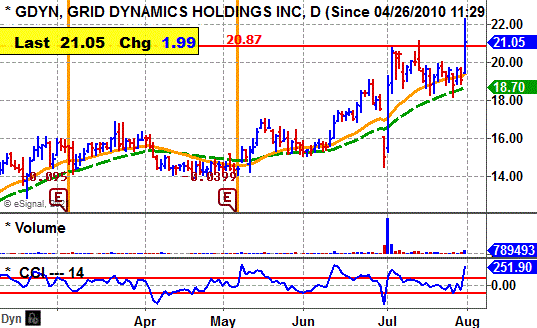 GDYN's long-term chart shows the stock climbing from a low of $4.61 in 202 to a peak at $21.05.
The stock came public in 2018 at $9.50.
GDYN's daily chart shows the stock climbing from $14 back in April to a peak at $20.87 in July.
The stock put down a tight flat base.
It breaks out with a widening of the spread and a pickup in volume.
The stock's CCI momentum indicator is strongly bullish.
Earnings Outlook
GDYN's earnings this year should soar 71% to 24 cents a share from the 14 cents the prior year.
GDYN has a price-earnings ratio of 87.
Looking to 2022, the Street predicts a 35% jump in net to 32 cents a share from the anticipated 24 cents this year.
Net for the second quarter should leap 500% to 6 cents a share from one cent the prior year.
Three analysts follow the stock.
The company beat the Street estimate the prior quarter by two cents a share.
Net for the third quarter should rise 20% to 6 cents a share from 5 cents the year before.
Strategy Opinion: TTD is targeting GDYN for a move to $26 within the next few months, or sooner.
A protective stop can be placed near $19.
Intermediate-Term Rating: Average.
Suitability: Aggressive Bulls.
TTD's special research of Stock's Prior Performance:
|
Breakout Success |
Bullish |
GDYN scored a big gain off a recent breakout. |
|
Response to Net |
Bullish |
GDYN rose 3 times after 4 earnings reports. |
|
Seasonal Success |
Bullish |
GDYN avg. gain 5.6% in Aug, 2.2% in Sept. prior years. |
|
Earnings Beats |
Bullish |
GDYN beat Street net estimate 3 times after 5 reports. |
Stock's Prior Performance After A Breakout
|
Stock's % Change from Breakout to peak - prior to cut below 50-day M/A. |
Date of Breakout |
Break point Price |
Stocks Price Peak after Breakout - prior to cut below 50-day M/A |
Date Trade Closed |
|
12% |
6/14/2021 | 16.88 | 18.84 | 6/24/2021 |
|
81% |
11/18/2020 | 8.99 | 16.25 | 3/22/2021 |
(In actual trading, entry and exit points could vary depending on broker execution.
Also, ideal are breakouts to a new 52-week high or better, perhaps all-time highs.)
Stock's Long-term Chart
Stock's Price Performance after Reporting Earnings
Stock's Performance Chart with Quarterly Earnings Markers vs. S&P 500
Insider Buying in Green - Insider Selling in Red
Charts of Selected Breakout Stocks
|
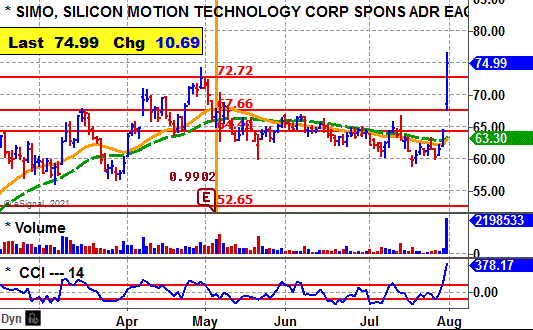
TTD's Quality Rating of Stock - SIMO - ABOVE AVERAGE |
|
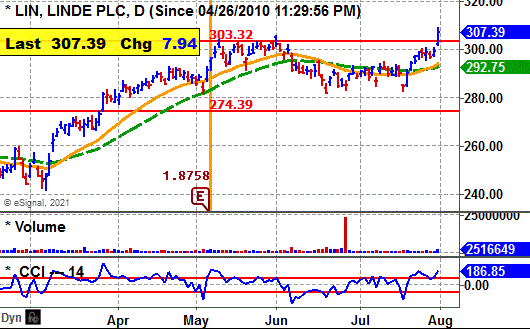
TTD's Quality Rating of Stock - LIN - ABOVE AVERAGE |
|
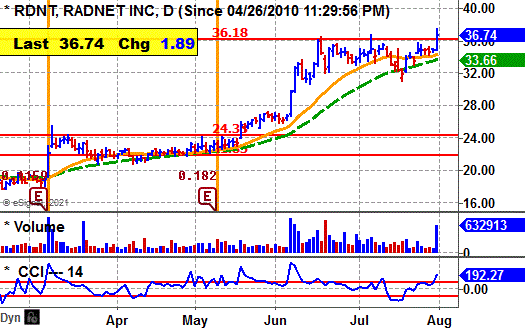
TTD's Quality Rating of Stock - RDNT - ABOVE AVERAGE |
|
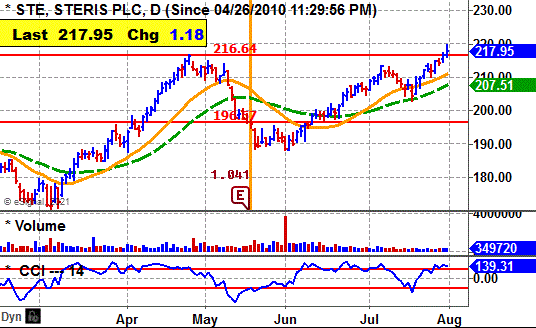
TTD's Quality Rating of Stock - STE - ABOVE AVERAGE |

Ticker Tape DigestÆs Daily List of ōStocks To Sell or Sell Shortö ranks stocks well timed to be sold immediately based on daily trading. The list can be used as an alert to reduce current long-term positions.
Shorts from tape action - 4
Stocks Screened - 12,234
Long-Term Environment for bears: Unfavorable.
Bear Side - Small list of shorts with some good plays for aggressive bears.
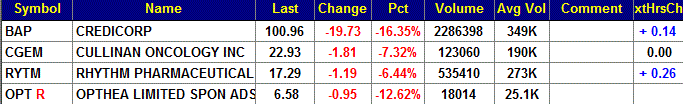
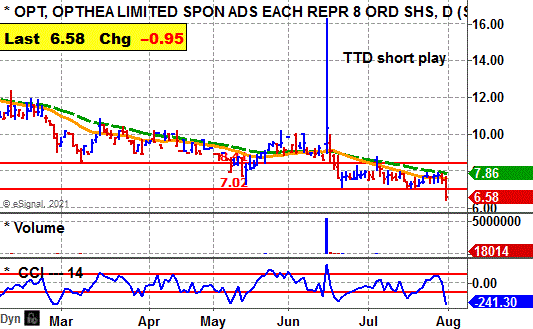
OPT, York, Canada, develops therapies to treat diabetic problems. Annual revenues: $87,000 Australian dollars. OPT's stock falls sharply Friday and undercuts key technical support. 
So far today, OPT is trading 18,014 shares. Its average daily volume is 25,000 shares.
OPT's stock moved sideways in the morning. Then in the afternoon OPT stock fell sharply and undercut key support.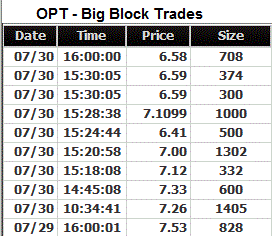
The stock was unchanged in after-hours trading.
Tape Action
OPT's tape actions shows the recent block trades.
One can see the price for the blocks falling from $7.53 in the prior session to $6.41 late in the day.
A key bearish trade came in the morning when a block of 1,405 shares crossed at $7.26 a share.
That was down from the prior block the day before at $7.53 on 828 shares.
Business
OPT said the FDA granted Fast Track designation for the company's VEGF-C/-D 'trap' inhibitor, OPT-302, in combination with anti-VEGF-A therapy. It is used to treat patients with neovascular age-related macular degeneration.
Earnings:
This fiscal year ending in June the Street predicts a loss of $1.30 a share.
Looking out to fiscal 2022, the Street projects a loss of $1.33 a share.
Charts:
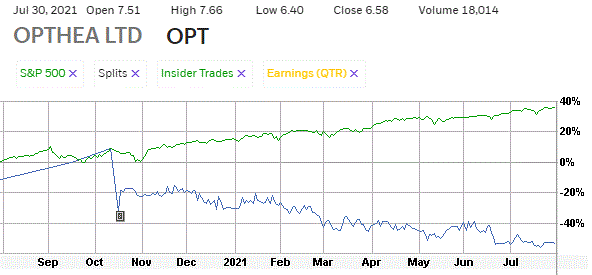
OPT's 12-month performance chart shows the stock down 45% versus a 38% gain for the stock market.
Insider activity was not available.
OPT's long-term chart shows the stock climbing from $1.40 in 2014 to a peak at $21 by 2020.
The stock then trended lower and now breaks below support.
OPT's daily chart shows the stock moving lower from $12 in January to around $7.
The stock then tried to form a bottom. However, it now breaks below support.
The stock's CCI momentum indicator is very bearish.
Strategy Opinion: TTD is targeting OPT for a decline to $5 within the next few months, or sooner. A protective stop buy can be placed near $7
Suitability: Aggressive Bears.
TTD's Stock Probability research of Prior Performance:
|
Seasonal Success |
Bearish |
OPT fell 17% in July. |
|
TTD's Quality Rating of Stock - OPT - BELOW AVERAGE |
Stock's Performance Chart with Quarterly Earnings Markers vs. S&P 500
Insider Buying in Green - Insider Selling in Red
TTD columnist Leo Fasciocco has covered the stock market for over 30 years. His articles appear in many publications. He has also been a speaker at the Money Show conferences. He has been on television and radio. He is author of many educational articles about stock investing and the book ōGuide To High-Performance Investing.ö

For information to subscribe to the Ticker Tape Digest Services call: Beverly Owen at 1-480-704-3331.
Distributed by Corona Publishing Enterprises. TickerTape Digest Inc. 1220 W. Sherri, Gilbert, Az. 85233.
TTD ōProfessional Reportö is available on the Web: $100 per month. Password needed. Published daily - around 20 times a month.
TTD Pro Report includes a Morning chart slide show of breakout stocks, a Midsession video-audio show with commentary on breakout stocks and shorts and a Final end of day overall report on breakout stocks for the session, short plays and accumulation plays. There are other features too such as Quick Trades and Long-term Plays.
TTD Daily Report is $39. It covers a Morning slide show of charts of stocks breaking out and a TTD end of day print report covering breakout stocks and shorts.
Credit cards accepted. Payable to Corona Publishing Enterprises.
(The information contained has been prepared from data deemed reliable but there is no guarantee of complete accuracy. Ticker Tape Digest Inc. is not affiliated with any broker, dealer or investment advisor. Nothing in this publication constitutes an offer, recommendation or solicitation to buy or sell any securities. Further research is advised. This report is copyrighted and no redistribution is permitted with out permission.)