![]()
|
|
|
Go to Video Show - "How to Make Money With Breakout Stocks |
|---|

By Leo Fasciocco -- TTD
Ticker Tape Digest presents its daily stock market report containing stocks to go long as Breakout Trades, Quick Trades, or Bargain Accumulation Trades.
We also feature stocks under Significant Accumulation that are poised to breakout.
|
Ticker Tape Digest's Daily schedule guide for TTD subscribers 1. Pre-market - check Breakout Watch List and Quick Trades. 2. Morning - (11:30 - 12 A.M.) - check breakout stocks tape and breakout chart slide show. 3. Midday (1 P.M.) check TTD Midsession Report and see market video show. 4. After close (4 P.M.) check final TTD Report for day. Trading Strategies Bullish Aggressive Investors Bullish - "Breakout Stocks" - ideally suited for bull markets and special situation stocks. Potential for large returns. (See Performance) Aggressive Investor Bullish- "Quick Trade Stocks" -ideally suited for entry into top performing issues looking for a small quick profit." (See Performance) Conservative Investors "Bargain Buy Trades for the Long Term." Ideally suited for entry into top performing big cap stocks on pullbacks within overall up trend.(See Performance) Bearish Aggressive Bearish Investors - "Breakdown Stocks" to Sell Short. Ideally suited for bear markets or market pull backs. Potential for large returns (See Performance) |
|---|
The TTD report also contains stocks to short as breakdown plays and as bargain (swing trade) shorts.
Investors should tend to try to go with a strategy that fits with the stock market's trend, unless there is a special situation play.
TTD's Breakout Stocks - Long are
most suitable for aggressive investors seeking ideal entry points into leading stocks, especially during bull markets. They can do extremely well in bull markets with gains of as much as several hundred percent. 
These stocks can also do extremely well during strong market rallies, or if they are in a industry group that is performing very well. They tend to have strong earnings outlooks and are near new-52 week, or all-time highs.
TTD Swng - Quick Trade Stocks - Long These are leading issues that have pulled back in recent days, but could move higher soon. They are most suitable for Aggressive Investors willing to trade short term. These stocks will do extremely well during market advances. They have about 74% win rate. During market rally sequences the win rate is even higher. The return is small 3% to 8% in just a few days.
TTD also presents Stocks To Sell or Sell Short. These issues are suitable for aggressive investors willing to take short positions both as trades or for longer-term plays. These stocks will do very well during bear markets or market pull backs.
TTD's Bearish breakdown stocks to sell short. These issues have potential to fall sharply. They often show a technical breakdown and also some fundamental business problem such as weak earnings.
TTD's multi-media updates include a slide-show that presents charts and analysis at midsession. Some times TTD presents feature analysis on stocks and the market. TTD uses Windows Media Files. (WMV).
TTD also presents a "Breakout Watch List" that is up dated daily. This list consists of key stocks in position to breakout. A close watch of this list can put you in the stock just as it breaks out. A good idea is to study the list and be ready to move into a stock quickly as it hits its breakpoint.
TTD often suggests using stop buy orders to enter. It is very important to buy a breakout stock as close as possible to the breakpoint. The idea is to get "elbow room" if the stock should follow through to the upside. This is very important in being successful in making big money with breakout stocks.
It is also essential to have a stop loss strategy for all stocks in which positions are taken. Not every stock will work as expected. It is important for investors to "police" their portfolios and avoid getting trapped in any bad positions.
Quality rating of breakout Two key factors: 1 - Stock near all-time high in price or near a 52-week high. 2 - earnings growth current year is strong. The ideal play is a stock with an Above Average Quality Rating. The stock is near a new high and will have strong earnings. TTD's other ratings are Average and Below Average.
TTD also has special feature sections on Educational Tips on Investing.
To email Mr. Leo Fasciocco leo@tickertapedigest.com.
For service, email Beverly Owen owen@tickertapedigest.com. TTDÆs Tel: 1-480-878-8381 or 480-704-3331.
Monday - August 2, 2021
TTD's Breakout Stocks
Stock Market Overview
Total Buy Breakouts - 5
Quality of Breakouts - Below Average.
Stocks Screened - 12,234
Bull side - Small list of breakouts and extremely selective.
Stock market - Major averages remain bullish in all time sectors.
Comment - Market is vulnerable to the downside. Bulls be alert and careful.
See Latest Earnings Reports - A company that tops the Street's highest earnings estimate has potential to go higher. Key earnings beats - ON, TSEM, MFIN, DAC and IPI.
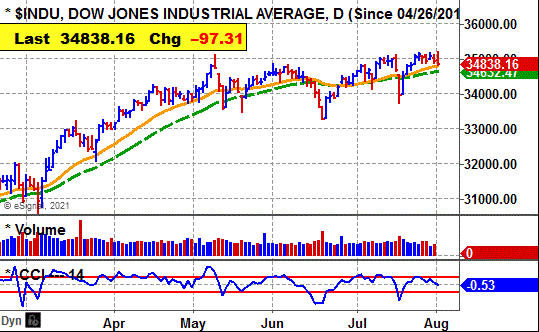
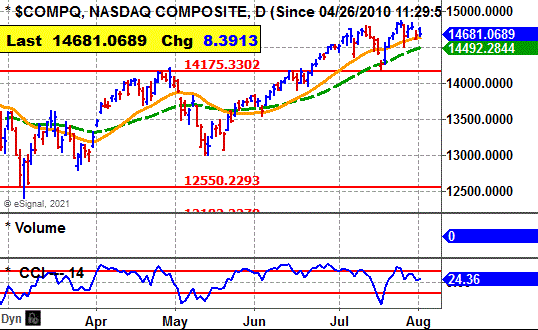
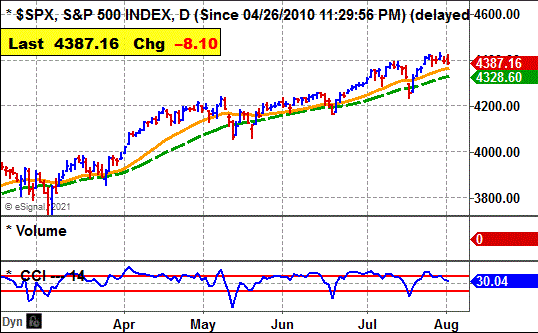
Stock Market Momentum
(Daily is based on a moving average)
|
Market (Daily) |
Market (Weekly) |
Market (Monthly) |
|
Dow - Bullish |
Dow - Bullish |
Dow - Bullish |
|
Nasdaq - Bullish |
Nasdaq - Bullish |
Nasdaq - Bullish |
|
S&P 500 - Bullish |
S&P 500 - Bullish |
S&P 500 - Bullish |
 Ticker Tape Digest's
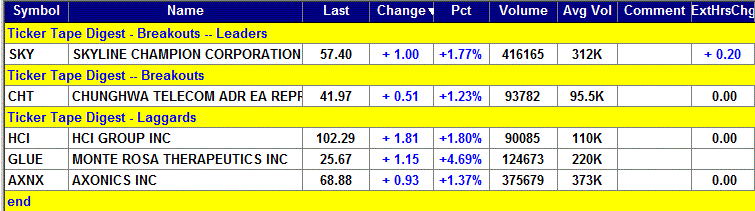
|
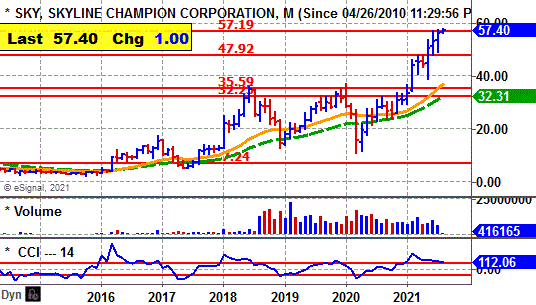
TTD's Quality Rating of Stock - SKY - ABOVE AVERAGE |
SKY, based in Troy, Mich., makes manufactured and modular homes. Annual revenues: $1.4 billion. SKY's stock moves higher Monday and breaks out from its six-week. cup-and-handle base.
So far today, SKY is trading 416,165 shares. Its average daily volume is 312,000 shares.
TTD sees good chances for more on the upside.
SKY is a leading stock having made a fourfold move the past year-and-half.
Monday, SKY's stock moved higher in the morning to clear its breakpoint but then faded back.
However, the stock then worked steadily higher to surpass its breakpoint and reach an intraday high in the afternoon at $57.82.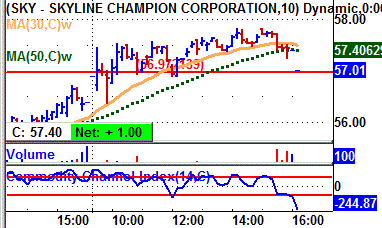
In after-hours trading, SKY was up 20 cents a share.
Tape Action
SKY's tape action shows the recent block trades.
One can see the price for the blocks climbing from $56.40 in the prior session to as high as 57.72 in the afternoon.
A key bullish trade came in the morning when a block of 2,356 shares crossed the tape at $56.72.
That was up from the prior block at $56.40 on 49,506 shares in the prior session.
Near the close a big block of 32,065 shares crossed at $57.40.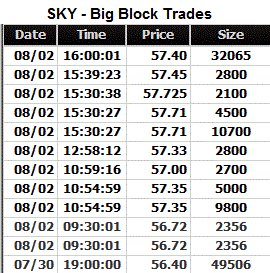
That was down from the prior block at $57.45 on 2,800 shares.
Business
SKY makes modular homes, park-models and modular buildings for the multi-family, hospitality, senior and workforce housing sectors.
SKY has 38 plants in the U.S. and western Canada.
The firm makes homes under the brand names of Skyline Homes, Champion Home Builders, Athens Park Models, Dutch Housing, Excel Homes, Homes of Merit, Titan Homes in the U.S. and Moduline and SRI Homes in western Canada.
Its Star Fleet trucking business provides transportation services.
Charts
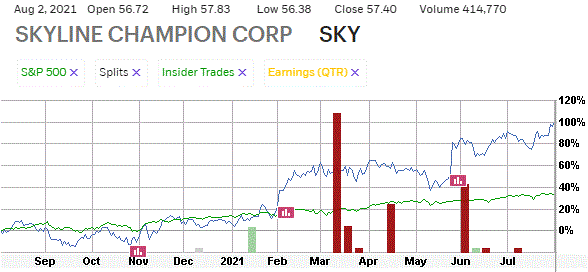
SKY's 12-month performance chart shows the stock up 100% versus a 35% gain for the stock market.
Insiders were recent sellers at $43 to $53 a share.
They have not done any recent buying, although they have received stock options.
SKY's long-term chart shows the stock climbing from $3.69 in 2016 to a peak at $37 by early 2020.
The stock was dragged down to $10.82 in early 2020 during the stock market selloff. SKY has since surged back to a new high and closing at $57.40.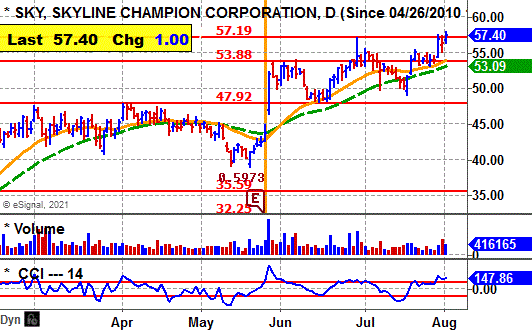
SKY's daily chart shows the stock climbing from near $40 in May to a peak near $57.19.
The stock formed a small cup-and-handle base.
The breakout carries the stock to a new high.
SKY's CCI momentum indicator is solidly bullish.
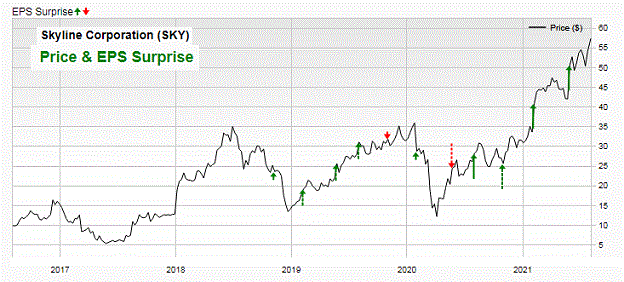
Earnings Outlook
Net for the fiscal year ending in March of 2022 should climb 23% to $1.88 a share from the $1.53 the prior year.
The stock has a price-earnings ratio of 30.
Looking out to fiscal 2023, the Street predicts a 13% increase in net to $2.13 a share from the anticipated $1.88 this fiscal year.
Quarterly earnings will be strong.
Net for the upcoming fiscal first quarter ending in June should leap 155% to 56 cents a share from the 22 cents the prior year.
The company beat the Street estimate the past four quarters by 25 cents a share, 12 cents, 7 cents and 15 cents.
Profits for the fiscal second quarter ending in September should rise 39% to 43 cents a share from the 31 cents the previous year.
Strategy Opinion: TTD targets SKY for a move to $67 within the next few months or sooner. A protective stop can be placed near $52.
Intermediate-Term Rating: Average.
Suitability: Average Bulls.
TTD's special research of Stock's Prior Performance:
|
Breakout Success |
Bullish |
SKY scored big gains off recent breakouts. |
|
Response to Net |
Bullish |
SKY rose 5 times after 9 earnings reports. |
|
Seasonal Success |
Bullish |
SKY avg. gain 14.7% in Aug., 0.4% in Sept. prior years. |
|
Earnings Beats |
Bullish |
SKY beat Street net estimate 9 times after 11 reports. |
Stock's Prior Performance After A Breakout
|
Stock's % Change from Breakout to peak - prior to cut below 50-day M/A. |
Date of Breakout |
Break point Price |
Stocks Price Peak after Breakout - prior to cut below 50-day M/A |
Date Trade Closed |
|
15% |
5/26/2021 | 47.92 | 54.94 | 7/1/2021 |
|
32% |
2/1/2021 | 35.59 | 46.92 | 3/1/2021 |
|
85% |
1/4/2018 | 13.09 | 24.28 | 1/25/2018 |
(In actual trading, entry and exit points could vary depending on broker execution.
Also, ideal are breakouts to a new 52-week high or better, perhaps all-time highs.)
Stock's Long-term Chart
Stock's Price Performance after Reporting Earnings
Stock's Performance Chart with Quarterly Earnings Markers vs. S&P 500
Insider Buying in Green - Insider Selling in Red
Charts of Selected Breakout Stocks
|
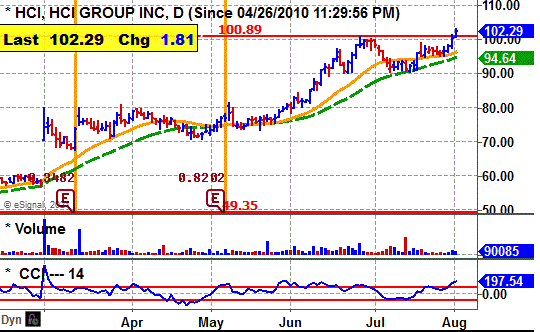
TTD's Quality Rating of Stock - HCI - AVERAGE |
|
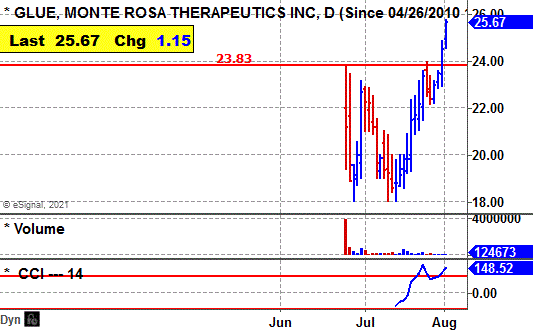
TTD's Quality Rating of Stock - GLUE - BELOW AVERAGE |
|
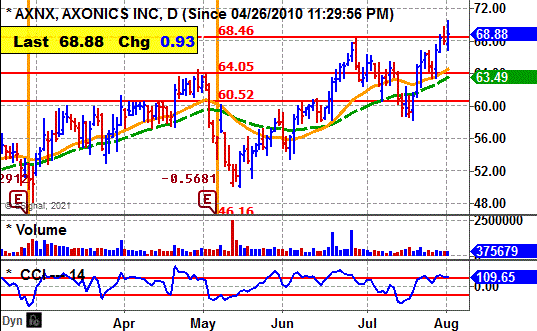
TTD's Quality Rating of Stock - AXNX - BELOW AVERAGE |

Ticker Tape DigestÆs Daily List of ōStocks To Sell or Sell Shortö ranks stocks well timed to be sold immediately based on daily trading. The list can be used as an alert to reduce current long-term positions.
Shorts from tape action - 2
Stocks Screened - 12,234
Long-Term Environment for bears: Unfavorable.
Bear Side - Only two shorts, but interesting plays for aggressive bears.
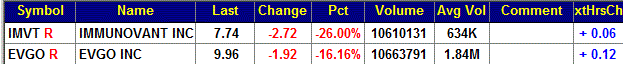
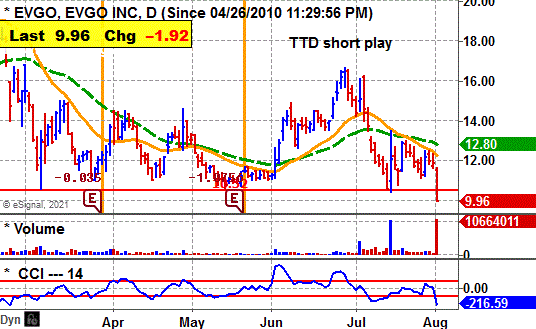
EVGO, based in Los Angeles, provides charging places for electric vehicles. Annual revenues: Nil. EVGO's stock falls sharply Monday and undercuts key technical support. 
So far today, EVGO is trading a heavy 10.7 million shares, five times its average daily volume of 1.8 million shares.
TTD sees more on the downside.
EVGO's stock fell in the morning and undercut key technical support.
In the afternoon, EVGO moved lower and was unable to rally.
Tape Action
EVGO's tape action shows the recent block trades.
One can see the price for the blocks falling from $12 in the prior session to as low as $9.96 near the close
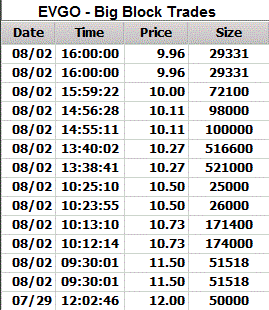
A key bearish trade came in the morning when a block of 51,518 shares crossed the tape at $11.50.
That was down from the prior block at $12 on 50,000 shares in the prior session.
Near the close a block of 29,331 shares crossed at $9.96 (duplicated). That was down from the prior block at $10 on 72,100 shares.
Business
EVGO provides a public fast charging network for electric vehicles.
The Company's fast charging network is powered by renewable energy.
The company provides charging services close to where drivers live, work and play, whether for a daily commute or a commercial fleet.
EVGO has 800 fast charging locations.
Earnings:
This year, analysts predict a loss of 29 cents a share for EVGO. They see the same loss coming in 2022.
For the second quarter, the Street expects a loss of 7 cents a share and for the third quarter a loss of 8 cents a share.
Charts:
EVGO's daily chart shows the stock peaking at $16.64 in June. The stock moved lower and now cuts below support with heavy volume.
It was as high as $24.34 in early 2021.
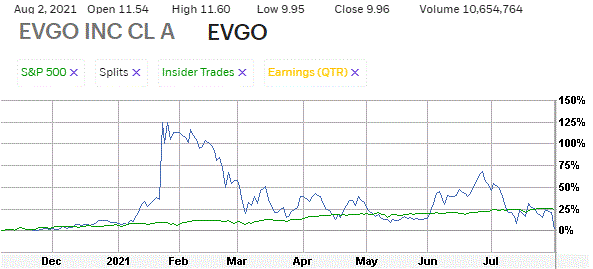
EVGO's performance chart shows the stock up 2% versus a gain of 25% for the stock market.
Strategy Opinion: TTD is targeting EVGO for a decline to $7.90 within the next few months, or sooner. A protective stop buy can be placed near $10.50
Suitability: Aggressive Bears.
TTD's Stock Probability research of Prior Performance:
|
Response to Net |
Bearish |
EVGO fell 2 times after 2 earnings reports. |
|
Seasonal Success |
Bearish |
EVGO loss avg 16.2% in Aug. |
|
TTD's Quality Rating of Stock - EVGO - BELOW AVERAGE |
Stock's Performance Chart with Quarterly Earnings Markers vs. S&P 500
Insider Buying in Green - Insider Selling in Red
TTD columnist Leo Fasciocco has covered the stock market for over 30 years. His articles appear in many publications. He has also been a speaker at the Money Show conferences. He has been on television and radio. He is author of many educational articles about stock investing and the book ōGuide To High-Performance Investing.ö

For information to subscribe to the Ticker Tape Digest Services call: Beverly Owen at 1-480-704-3331.
Distributed by Corona Publishing Enterprises. TickerTape Digest Inc. 1220 W. Sherri, Gilbert, Az. 85233.
TTD ōProfessional Reportö is available on the Web: $100 per month. Password needed. Published daily - around 20 times a month.
TTD Pro Report includes a Morning chart slide show of breakout stocks, a Midsession video-audio show with commentary on breakout stocks and shorts and a Final end of day overall report on breakout stocks for the session, short plays and accumulation plays. There are other features too such as Quick Trades and Long-term Plays.
TTD Daily Report is $39. It covers a Morning slide show of charts of stocks breaking out and a TTD end of day print report covering breakout stocks and shorts.
Credit cards accepted. Payable to Corona Publishing Enterprises.
(The information contained has been prepared from data deemed reliable but there is no guarantee of complete accuracy. Ticker Tape Digest Inc. is not affiliated with any broker, dealer or investment advisor. Nothing in this publication constitutes an offer, recommendation or solicitation to buy or sell any securities. Further research is advised. This report is copyrighted and no redistribution is permitted with out permission.)