![]()
|
|
|
Go to Video Show - "How to Make Money With Breakout Stocks |
|---|

By Leo Fasciocco -- TTD
Ticker Tape Digest presents its daily stock market report containing stocks to go long as Breakout Trades, Quick Trades, or Bargain Accumulation Trades.
We also feature stocks under Significant Accumulation that are poised to breakout.
|
Ticker Tape Digest's Daily schedule guide for TTD subscribers 1. Pre-market - check Breakout Watch List and Quick Trades. 2. Morning - (11:30 - 12 A.M.) - check breakout stocks tape and breakout chart slide show. 3. Midday (1 P.M.) check TTD Midsession Report and see market video show. 4. After close (4 P.M.) check final TTD Report for day. Trading Strategies Bullish Aggressive Investors Bullish - "Breakout Stocks" - ideally suited for bull markets and special situation stocks. Potential for large returns. (See Performance) Aggressive Investor Bullish- "Quick Trade Stocks" -ideally suited for entry into top performing issues looking for a small quick profit." (See Performance) Conservative Investors "Bargain Buy Trades for the Long Term." Ideally suited for entry into top performing big cap stocks on pullbacks within overall up trend.(See Performance) Bearish Aggressive Bearish Investors - "Breakdown Stocks" to Sell Short. Ideally suited for bear markets or market pull backs. Potential for large returns (See Performance) |
|---|
The TTD report also contains stocks to short as breakdown plays and as bargain (swing trade) shorts.
Investors should tend to try to go with a strategy that fits with the stock market's trend, unless there is a special situation play.
TTD's Breakout Stocks - Long are
most suitable for aggressive investors seeking ideal entry points into leading stocks, especially during bull markets. They can do extremely well in bull markets with gains of as much as several hundred percent. 
These stocks can also do extremely well during strong market rallies, or if they are in a industry group that is performing very well. They tend to have strong earnings outlooks and are near new-52 week, or all-time highs.
TTD Swng - Quick Trade Stocks - Long These are leading issues that have pulled back in recent days, but could move higher soon. They are most suitable for Aggressive Investors willing to trade short term. These stocks will do extremely well during market advances. They have about 74% win rate. During market rally sequences the win rate is even higher. The return is small 3% to 8% in just a few days.
TTD also presents Stocks To Sell or Sell Short. These issues are suitable for aggressive investors willing to take short positions both as trades or for longer-term plays. These stocks will do very well during bear markets or market pull backs.
TTD's Bearish breakdown stocks to sell short. These issues have potential to fall sharply. They often show a technical breakdown and also some fundamental business problem such as weak earnings.
TTD's multi-media updates include a slide-show that presents charts and analysis at midsession. Some times TTD presents feature analysis on stocks and the market. TTD uses Windows Media Files. (WMV).
TTD also presents a "Breakout Watch List" that is up dated daily. This list consists of key stocks in position to breakout. A close watch of this list can put you in the stock just as it breaks out. A good idea is to study the list and be ready to move into a stock quickly as it hits its breakpoint.
TTD often suggests using stop buy orders to enter. It is very important to buy a breakout stock as close as possible to the breakpoint. The idea is to get "elbow room" if the stock should follow through to the upside. This is very important in being successful in making big money with breakout stocks.
It is also essential to have a stop loss strategy for all stocks in which positions are taken. Not every stock will work as expected. It is important for investors to "police" their portfolios and avoid getting trapped in any bad positions.
Quality rating of breakout Two key factors: 1 - Stock near all-time high in price or near a 52-week high. 2 - earnings growth current year is strong. The ideal play is a stock with an Above Average Quality Rating. The stock is near a new high and will have strong earnings. TTD's other ratings are Average and Below Average.
TTD also has special feature sections on Educational Tips on Investing.
To email Mr. Leo Fasciocco leo@tickertapedigest.com.
For service, email Beverly Owen owen@tickertapedigest.com. TTDÆs Tel: 1-480-878-8381 or 480-704-3331.
Monday - August 9, 2021
TTD's Breakout Stocks
Stock Market Overview
Total Buy Breakouts - 10
Quality of Breakouts - Average
Stocks Screened - 12,234
Bull side - Average.
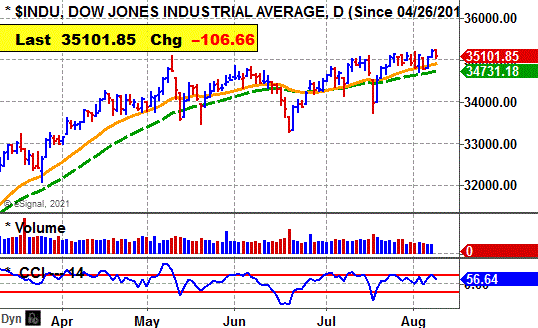
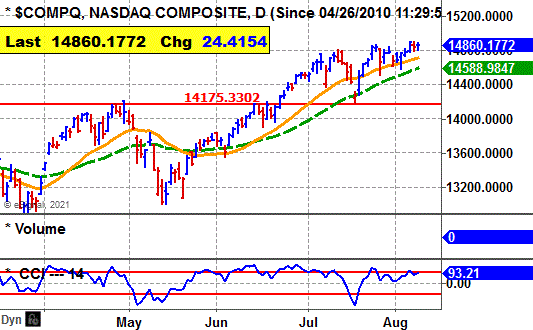
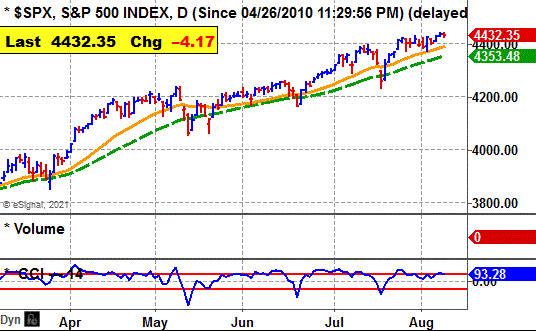
Stock market - Major averages are bullish in all time sectors.
Comment - Stock market holding up trend, but still basing. Bulls be selective.
See Latest Earnings Reports - A company that tops the Street's highest earnings estimate has potential to go higher. Key earnings beats - VRTV, BNTX, KNDI, III and TSN.
Stock Market Momentum
(Daily is based on a moving average)
|
Market (Daily) |
Market (Weekly) |
Market (Monthly) |
|
Dow - Bullish |
Dow - Bullish |
Dow - Bullish |
|
Nasdaq - Bullish |
Nasdaq - Bullish |
Nasdaq - Bullish |
|
S&P 500 - Bullish |
S&P 500 - Bullish |
S&P 500 - Bullish |
 Ticker Tape Digest's
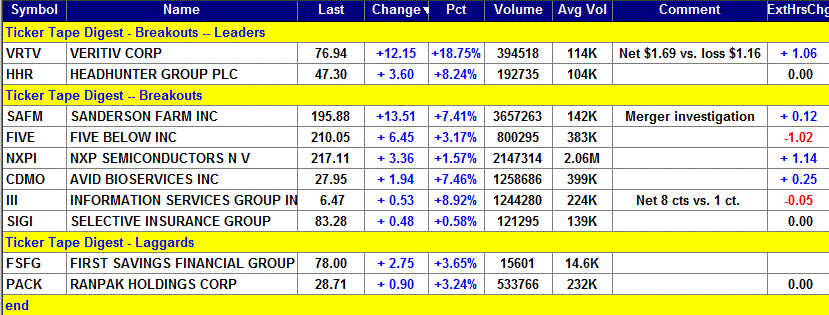
|
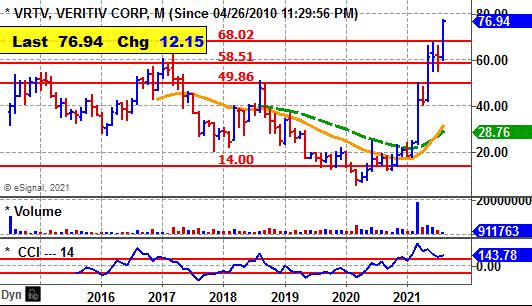
TTD's Quality Rating of Stock - VRTV - ABOVE AVERAGE |
VRTV, based in Atlanta, distributes paper products used for packaging and printing. Annual revenues: $6.3 billion. VRTV's stock moves higher Monday and breaks out from its 12-week flat base.
So far today, VRTV is trading 394,633 shares, triple its average daily volume of 114,000 shares.
TTD sees potential for more on the upside.
TTD recently highlighted VRTV as a potential breakout.
VRTV's stock surged higher in the morning and cleared its breakpoint line.
The key was stronger than expected quarterly earnings. 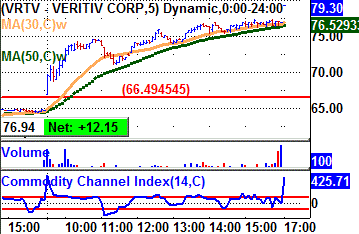
The stock worked steadily higher during the day and closed near its high for the session.
In after-hours trading, VRTV surged $4.06 a share.
VRTV came in with net for the second quarter of $1,69 a share versus a loss of $1.16 the year before.
The $!.69 topped the consensus estimate for the quarter of 8 cents a share.
Tape Action
VRTV's tape action shows the recent block trades.
One can see the price for the blocks climbing from $64.79 in the prior session to as high as $76.94 near the close.
A key bullish trade came in the morning when a block of 4,455 shares (duplicated) crossed the tape at $67.
That was up from the prior block at $64.79 on 7,361 shares in the prior session.
Near the close a big block of 24,579 shares crossed at $76.94.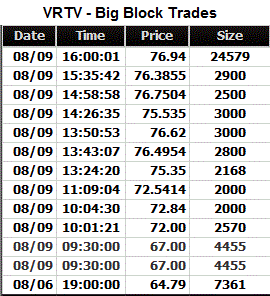
that was up from the prior block at $76.38 on 2,900 shares.
Business
VRTV is a distributor of print publishing and packaging products.
The Print segment sells commercial printing, writing, copying, digital, wide format and specialty paper products and graphics equipment.
The publishing segment sells coated and uncoated commercial printing papers. The packaging segment provides standard and custom packaging solutions.
Charts
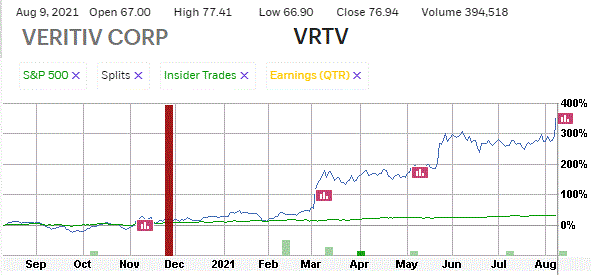
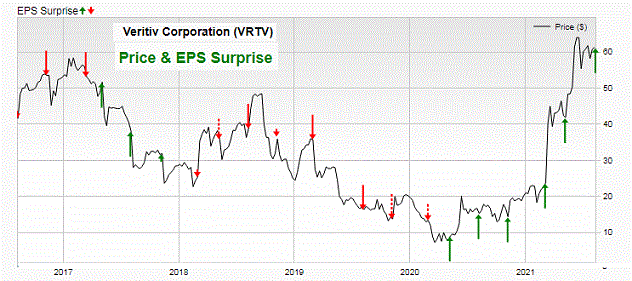
VRTV's 12-month performance chart shows the stock up 350% versus a 35% gain for the stock market.
Insiders were recent buyers at $39.49. They have not done any selling recently.
VRTV's long-term chart shows the stock coming public at $37.50 in 2014. The stock rose to $62.60 by early 2017. However, the stock rolled over and fell to $5.70 by early 2020.
Since then VRTV has soared back to a new all-time high.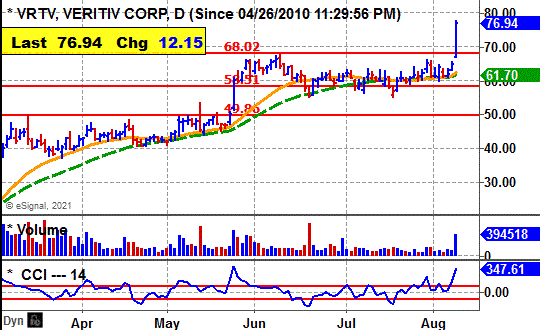
VRTV's daily chart shows the stock rising from $40 in April to a peak near $68 by June.
The stock pulled back slightly and formed a tight flat base.
The breakout is powerful coming with a widening of the daily price spread and expanding volume.
The stock's CCI momentum indicator is strongly bullish.
Earnings Outlook
This year, analysts predict a 116% surge in VRTV's net to $4.50 a share from the $2.08 the prior year.
Only one analyst follows the stock. However, that estimate most likely will be boosted.
Looking out to 2022, the Street projects an 18% rise in net to $5.30 a share from the anticipated $4.50 this year.
Strategy Opinion: TTD is targeting VRTV for a move to $92. A protective stop can be placed near $66.
Intermediate-Term Rating: Average.
Suitability: Average Bulls.
TTD's special research of Stock's Prior Performance:
|
Breakout Success |
Bullish |
VRTV scored big gains off recent breakouts. |
|
Response to Net |
Neutral |
VRTV rose 8 times after 16 earnings reports. |
|
Seasonal Success |
Bullish |
VRTV avg. gain 7.1% in Aug., loss 6.4% in Sept. prior years. |
|
Earnings Beats |
Bullish |
VRTV beat Street net estimate 5 times after 8 reports. |
Stock's Prior Performance After A Breakout
|
Stock's % Change from Breakout to peak - prior to cut below 50-day M/A. |
Date of Breakout |
Break point Price |
Stocks Price Peak after Breakout - prior to cut below 50-day M/A |
Date Trade Closed |
|
33% |
5/21/2021 | 49.86 | 66.47 | 6/8/2021 |
|
91% |
3/1/2021 | 23.93 | 45.63 | 4/6/2021 |
(In actual trading, entry and exit points could vary depending on broker execution.
Also, ideal are breakouts to a new 52-week high or better, perhaps all-time highs.)
Stock's Long-term Chart
Stock's Price Performance after Reporting Earnings
Stock's Performance Chart with Quarterly Earnings Markers vs. S&P 500
Insider Buying in Green - Insider Selling in Red
Charts of Selected Breakout Stocks
|
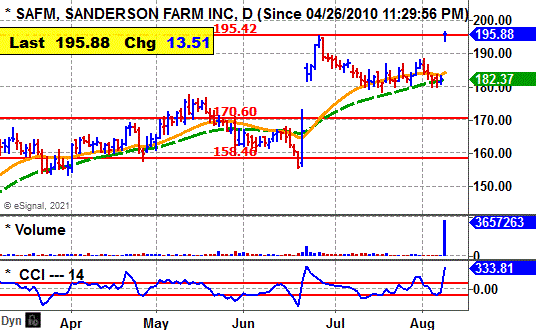
TTD's Quality Rating of Stock - SAFM - AVERAGE |
|
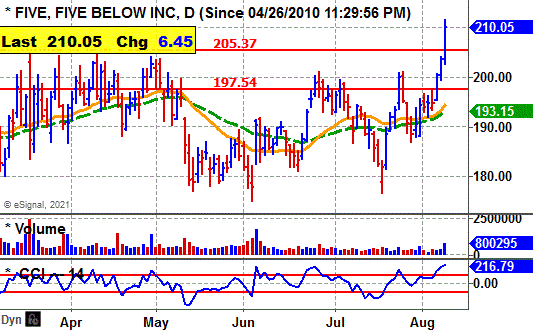
TTD's Quality Rating of Stock - FIVE - AVERAGE |
|
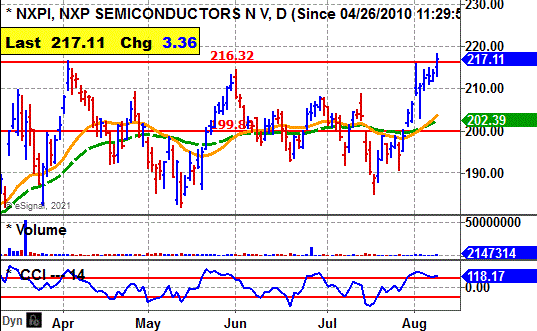
TTD's Quality Rating of Stock - NXPI - AVERAGE |
|
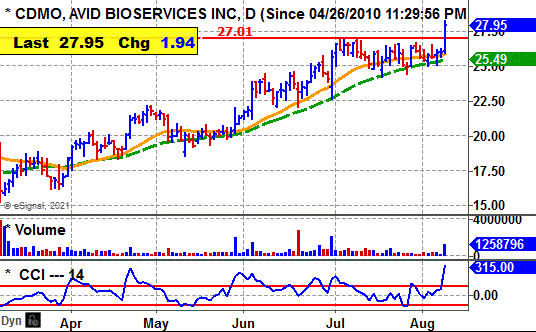
TTD's Quality Rating of Stock - CDMO - ABOVE AVERAGE |
Ticker Tape DigestÆs Daily List of ōStocks To Sell or Sell Shortö ranks stocks well timed to be sold immediately based on daily trading. The list can be used as an alert to reduce current long-term positions.
Shorts from tape action - 2
Stocks Screened - 12,234
Long-Term Environment for bears: Unfavorable.
Bear Side - Small list of shorts. Bears be conservative.

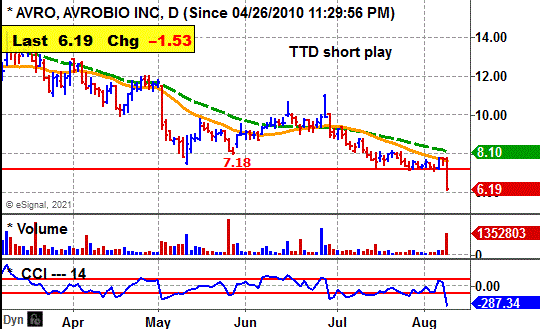
AVRO, based in Cambridge, Ma., is a medical research rim working on treatments for rare diseases. Annual revenues: Nil. AVRO's stock falls sharply Monday and undercuts key technical support. 
So far today, AVRO is trading a heavy 1.4 million shares, five times its average daily volume of 244,000 shares.
TTD sees more on the downside. 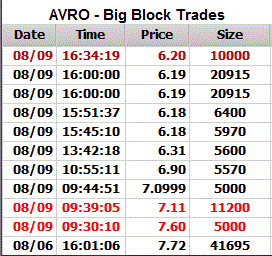
AVRO's stock moved lower in the morning and undercut key technical support.
The stock worked steadily lower. It touched an intraday low of $6.13 in the afternoon.
Tape Action
AVRO's tape action shows the recent block trades.
One can see the price for the blocks falling from $7.72 in the prior session to as low as $6.18 in the afternoon.
A key bearish trade came in the morning when a block of 11,200 shares crossed at $7.11.
That was down sharply from the prior block at $7.60 on 5,000 shares.
Business
AVRO is a clinical-stage gene therapy company developing curative ex vivo lentiviral-based gene therapies to treat rare diseases.
Its gene therapies employ hematopoietic stem cells that are extracted from the patient and then modified with lentiviral vectors to insert a functional copy of the gene that is defective in the target disease.
AVR-RD-03 is being developed to treat pompe disease.
Earnings:
This year, AVRO should show a loss of $2.65 a share compared with a loss of $3.31 the prior year.
Looking out to 2022, the Street predicts a loss of $2.61 a share.
For the upcoming third quarter, analysts expect a loss of 68 cents a share compared with a loss of $1.01 the prior year.
Charts:
AVRO's daily chart shows the stock declining from $11.20 in April down to $7.38 by July. The stock tried to form a bottom, but now breaks to the downside with heavy volume.
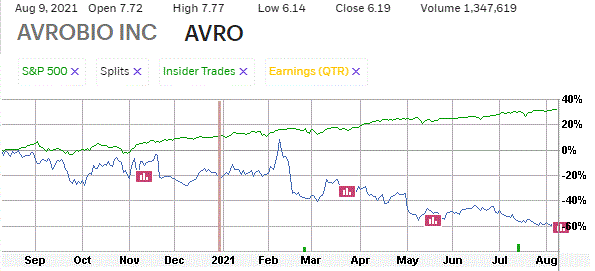
AVRO's 12-month performance chart shows the stock down 50% versus a 33% gain for the stock market.
Insiders were cent buyers in July at $8.35 a share. They have not done any recent selling.
Strategy Opinion: TTD is targeting AVRO for a decline to $4.80 within the next few months, or sooner. A protective stop buy can be placed near $6.60.
Suitability: Aggressive Bears.
TTD's Stock Probability research of Prior Performance:
|
Response to Net |
Neutral |
AVRO rose 1 time after 2 earnings reports. |
|
Seasonal Success |
Bearish |
AVRO lost avg 3.6% in Avg, 0.4% in Sept. prior years. |
|
Earnings Beats |
Bearish |
AVRO beat Street estimate 5 times after 12 reports. |
|
TTD's Quality Rating of Stock - AVRO - BELOW AVERAGE |
Stock's Performance Chart with Quarterly Earnings Markers vs. S&P 500
Insider Buying in Green - Insider Selling in Red
TTD columnist Leo Fasciocco has covered the stock market for over 30 years. His articles appear in many publications. He has also been a speaker at the Money Show conferences. He has been on television and radio. He is author of many educational articles about stock investing and the book ōGuide To High-Performance Investing.ö

For information to subscribe to the Ticker Tape Digest Services call: Beverly Owen at 1-480-704-3331.
Distributed by Corona Publishing Enterprises. TickerTape Digest Inc. 1220 W. Sherri, Gilbert, Az. 85233.
TTD ōProfessional Reportö is available on the Web: $100 per month. Password needed. Published daily - around 20 times a month.
TTD Pro Report includes a Morning chart slide show of breakout stocks, a Midsession video-audio show with commentary on breakout stocks and shorts and a Final end of day overall report on breakout stocks for the session, short plays and accumulation plays. There are other features too such as Quick Trades and Long-term Plays.
TTD Daily Report is $39. It covers a Morning slide show of charts of stocks breaking out and a TTD end of day print report covering breakout stocks and shorts.
Credit cards accepted. Payable to Corona Publishing Enterprises.
(The information contained has been prepared from data deemed reliable but there is no guarantee of complete accuracy. Ticker Tape Digest Inc. is not affiliated with any broker, dealer or investment advisor. Nothing in this publication constitutes an offer, recommendation or solicitation to buy or sell any securities. Further research is advised. This report is copyrighted and no redistribution is permitted with out permission.)