![]()
|
|
|
Go to Video Show - "How to Make Money With Breakout Stocks |
|---|

By Leo Fasciocco -- TTD
Ticker Tape Digest presents its daily stock market report containing stocks to go long as Breakout Trades, Quick Trades, or Bargain Accumulation Trades.
We also feature stocks under Significant Accumulation that are poised to breakout.
|
Ticker Tape Digest's Daily schedule guide for TTD subscribers 1. Pre-market - check Breakout Watch List and Quick Trades. 2. Morning - (11:30 - 12 A.M.) - check breakout stocks tape and breakout chart slide show. 3. Midday (1 P.M.) check TTD Midsession Report and see market video show. 4. After close (4 P.M.) check final TTD Report for day. Trading Strategies Bullish Aggressive Investors Bullish - "Breakout Stocks" - ideally suited for bull markets and special situation stocks. Potential for large returns. (See Performance) Aggressive Investor Bullish- "Quick Trade Stocks" -ideally suited for entry into top performing issues looking for a small quick profit." (See Performance) Conservative Investors "Bargain Buy Trades for the Long Term." Ideally suited for entry into top performing big cap stocks on pullbacks within overall up trend.(See Performance) Bearish Aggressive Bearish Investors - "Breakdown Stocks" to Sell Short. Ideally suited for bear markets or market pull backs. Potential for large returns (See Performance) |
|---|
The TTD report also contains stocks to short as breakdown plays and as bargain (swing trade) shorts.
Investors should tend to try to go with a strategy that fits with the stock market's trend, unless there is a special situation play.
TTD's Breakout Stocks - Long are
most suitable for aggressive investors seeking ideal entry points into leading stocks, especially during bull markets. They can do extremely well in bull markets with gains of as much as several hundred percent. 
These stocks can also do extremely well during strong market rallies, or if they are in a industry group that is performing very well. They tend to have strong earnings outlooks and are near new-52 week, or all-time highs.
TTD Swng - Quick Trade Stocks - Long These are leading issues that have pulled back in recent days, but could move higher soon. They are most suitable for Aggressive Investors willing to trade short term. These stocks will do extremely well during market advances. They have about 74% win rate. During market rally sequences the win rate is even higher. The return is small 3% to 8% in just a few days.
TTD also presents Stocks To Sell or Sell Short. These issues are suitable for aggressive investors willing to take short positions both as trades or for longer-term plays. These stocks will do very well during bear markets or market pull backs.
TTD's Bearish breakdown stocks to sell short. These issues have potential to fall sharply. They often show a technical breakdown and also some fundamental business problem such as weak earnings.
TTD's multi-media updates include a slide-show that presents charts and analysis at midsession. Some times TTD presents feature analysis on stocks and the market. TTD uses Windows Media Files. (WMV).
TTD also presents a "Breakout Watch List" that is up dated daily. This list consists of key stocks in position to breakout. A close watch of this list can put you in the stock just as it breaks out. A good idea is to study the list and be ready to move into a stock quickly as it hits its breakpoint.
TTD often suggests using stop buy orders to enter. It is very important to buy a breakout stock as close as possible to the breakpoint. The idea is to get "elbow room" if the stock should follow through to the upside. This is very important in being successful in making big money with breakout stocks.
It is also essential to have a stop loss strategy for all stocks in which positions are taken. Not every stock will work as expected. It is important for investors to "police" their portfolios and avoid getting trapped in any bad positions.
Quality rating of breakout Two key factors: 1 - Stock near all-time high in price or near a 52-week high. 2 - earnings growth current year is strong. The ideal play is a stock with an Above Average Quality Rating. The stock is near a new high and will have strong earnings. TTD's other ratings are Average and Below Average.
TTD also has special feature sections on Educational Tips on Investing.
To email Mr. Leo Fasciocco leo@tickertapedigest.com.
For service, email Beverly Owen owen@tickertapedigest.com. TTDÆs Tel: 1-480-878-8381 or 480-704-3331.
Thursday - August 12, 2021
TTD's Breakout Stocks
Stock Market Overview
Total Buy Breakouts - 4
Quality of Breakouts - Average.
Stocks Screened - 12,234
Bull side - Small list of breakouts. Bulls be conservative.
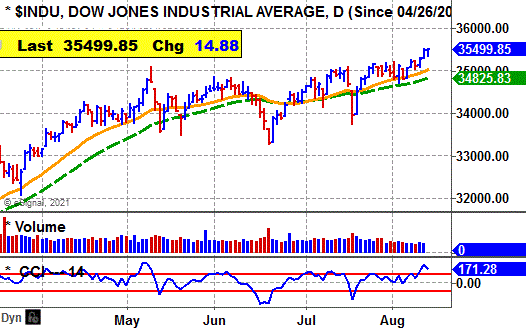
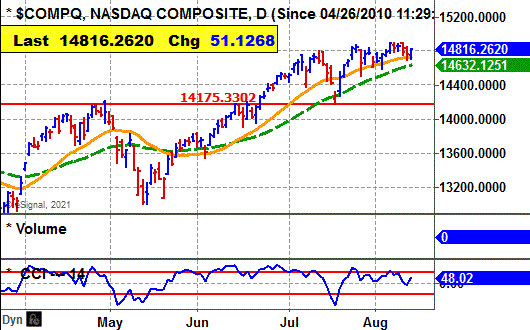
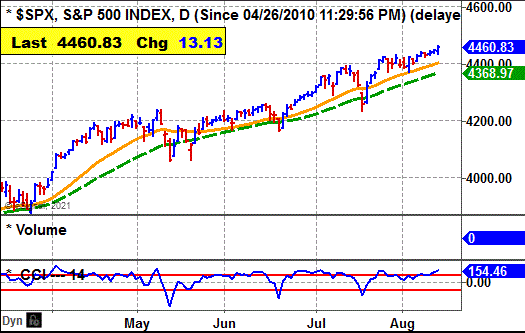
Stock market - Major averages remain bullish in all time sectors.
Comment - Bulls be conservative and watchful. Stock market still in a trading range.
See Latest Earnings Reports - A company that tops the Street's highest earnings estimate has potential to go higher. Key earnings beats -
Stock Market Momentum
(Daily is based on a moving average)
|
Market (Daily) |
Market (Weekly) |
Market (Monthly) |
|
Dow - Bullish |
Dow - Bullish |
Dow - Bullish |
|
Nasdaq - Bullish |
Nasdaq - Bullish |
Nasdaq - Bullish |
|
S&P 500 - Bullish |
S&P 500 - Bullish |
S&P 500 - Bullish |
 Ticker Tape Digest's
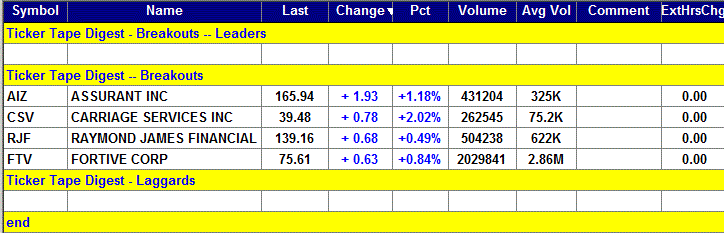
|
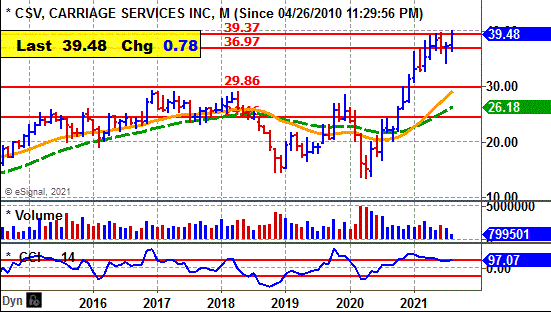
TTD's Quality Rating of Stock - CSV - AVERAGE |
CSV, based in Houston, provides funeral services. Annual revenues: $329 million. CSV's stock moves higher Thursday and breaks out from its two-month, cup-and-handle base. 
So far today, CSV is trading 262,545 shares, triple its average daily volume of 75,000 shares.
TTD sees potential for more on the upside.
CSV has a beta of 0.83 versus 1.00 for the stock market. So, the stock tends to be a slow mover. One must be patient. 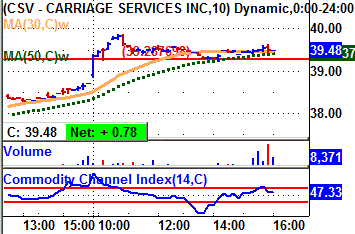
CSV's stock moved higher in the morning and cleared its breakpoint line.
The stock reached an intraday high in the morning at $39.87.
The stock then pulled back slightly and trended sideways the rest of the day.
CSV was unchanged in after-hours trading.
Tape Action
CSV's tape action shows the recent block trades.
One can see the price for the blocks rising from $38.70 in the prior session to as high as $39.58 in the afternoon.
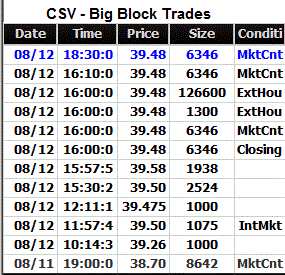 A key bullish trade came in the morning when a block of 1,000 shares crossed the tape at $39.26.
That was up from the prior block at $38.70 on 8,642 shares.
Near the close a massive block of 126,600 shares crossed at $39.48.
That came on a sequence started by a down tick from $39.50 on 229 shares.
Business
CSI provide death care services in the U.S.
The company operates in two areas: Funeral home operations and cemetery operations.
The funeral homes provide funeral services - traditional burial and cremation - and sells related merchandise, such as caskets and urns.
Its cemetery products cover interment services, the rights to interment in cemetery sites and related cemetery merchandise, such as memorials and vaults. It serves suburban and rural markets.
The company operates 183 funeral homes in 29 states and 29 cemeteries in 11 states.
Charts
CSV's 12-month performance chart shows the stock up 70% versus a 35% gain for the stock market.
Insiders were recent buyers at $36.98 to $38.19 in the open market and at $5.94 to $20.06 using stock options.
 They were sellers at $34 to $36 a share.
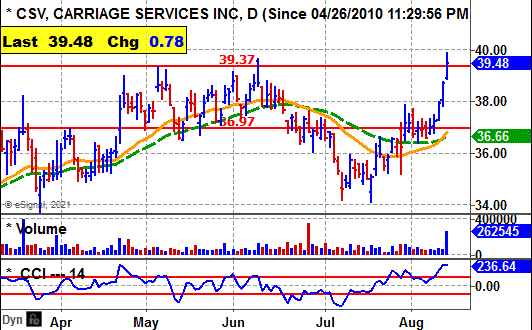
CSV's long-term chart shows the stock falling from $27 back in 2016 to $14.50 by late 2018.
The stock rallied back to $25 but then fell back again. This time to $13.54 due to the stock market drop.
Since then CSV has rallied strongly to $39.
CSV's daily chart shows the stock peaking near $39 in May. It has since fallen back to 34 and then rallied.
The breakout clears key resistance with a big pick up in volume. That is very bullish.
The stock's CCI momentum indicator is strongly bullish.
Earnings Outlook
This year, analysts predict a 43% jump in CSV's earnings to $2.66 a share from the $1.86 the prior year.
The stock has a price-earnings ratio of 14. That is attractive for value-growth investors.
Looking out to 2022, the Street predicts a 12% rise in net to $2.99 a share from the anticipated $2.66 this year.
Net for the third quarter should be up 16% to 59 cents a share from the 51 cents the prior year.
The highest estimate is at 60 cents a share.
CSV topped the consensus estimate the past four quarters by 14 cents a share, 22 cents, 4 cents and 20 cents.
Looking out to the fourth quarter, net should rise 12% to 64 cents a share from the 57 cents the previous year.
Strategy Opinion: TTD is targeting CSV for a move to $46 within the next few months, or sooner.
A protective stop can be placed near $37.90
Intermediate-Term Rating: Average.
Suitability: Average Bulls.
TTD's special research of Stock's Prior Performance:
|
Breakout Success |
Bullish |
CSV scored some big gains off recent breakouts. |
|
Response to Net |
Bullish |
CSV rose 9 times after 15 earnings reports. |
|
Seasonal Success |
Bullish |
CSV avg. gain 2.1% in Aug., loss 1% in Sept. prior years. |
|
Earnings Beats |
Bearish |
CSV beat Street net estimate 7 times after 20 reports. |
Stock's Prior Performance After A Breakout
|
Stock's % Change from Breakout to peak - prior to cut below 50-day M/A. |
Date of Breakout |
Break point Price |
Stocks Price Peak after Breakout - prior to cut below 50-day M/A |
Date Trade Closed |
|
5% |
4/22/2021 | 36.97 | 38.64 | 5/7/2021 |
|
22% |
12/21/2020 | 29.86 | 36.57 | 2/11/2021 |
|
50% |
10/28/2020 | 24.46 | 36.58 | 2/12/2021 |
|
26% |
12/7/2016 | 23.02 | 28.93 | 12/27/2016 |
(In actual trading, entry and exit points could vary depending on broker execution.
Also, ideal are breakouts to a new 52-week high or better, perhaps all-time highs.)
Stock's Long-term Chart
Stock's Price Performance after Reporting Earnings

Stock's Performance Chart with Quarterly Earnings Markers vs. S&P 500
Insider Buying in Green - Insider Selling in Red
Charts of Selected Breakout Stocks
|
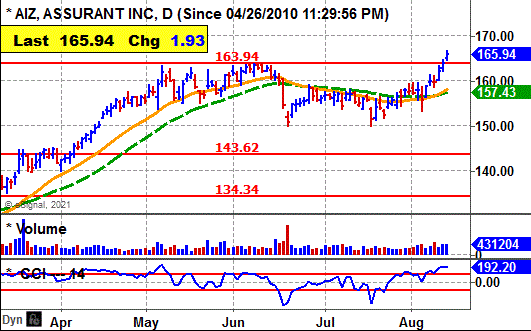
TTD's Quality Rating of Stock - AIZ - AVERAGE |
|
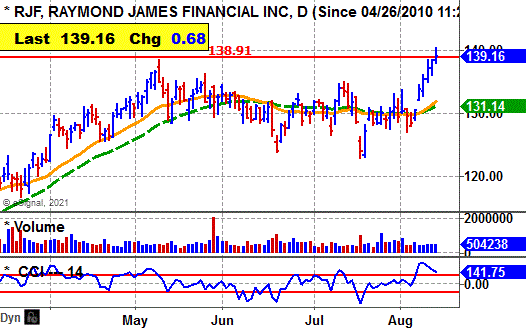
TTD's Quality Rating of Stock - RJF - AVERAGE |
|
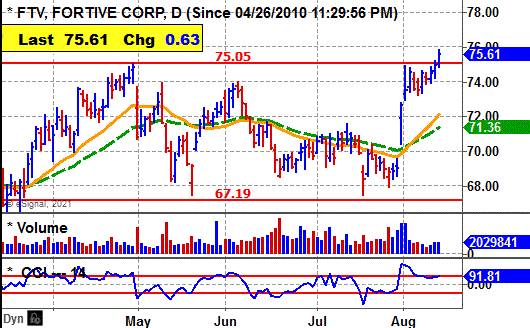
TTD's Quality Rating of Stock - FTV - AVERAGE |

Ticker Tape DigestÆs Daily List of ōStocks To Sell or Sell Shortö ranks stocks well timed to be sold immediately based on daily trading. The list can be used as an alert to reduce current long-term positions.
Shorts from tape action - 4
Stocks Screened - 12,234
Long-Term Environment for bears: Unfavorable.
Bear Side - Just a small list of shorts. Bears be conservative.
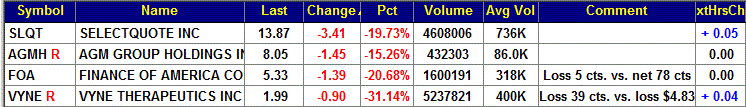
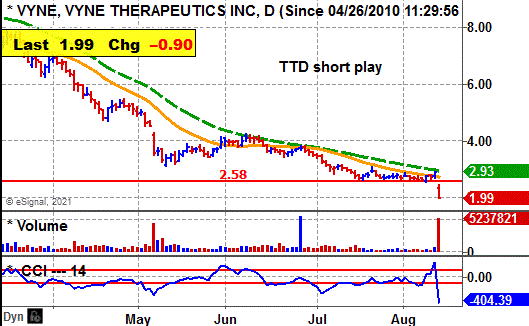
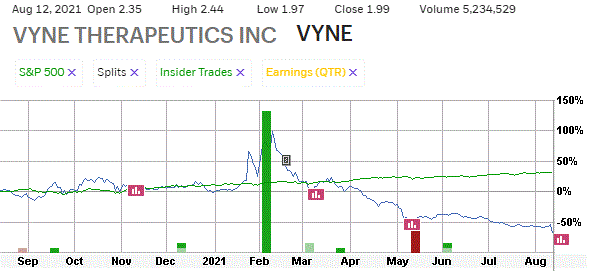
VYNE, based in Bridgewater, N.J., produces therapies to treat dematology. Annual revenues: $21 million. VYNE's stock falls sharply Thursday after reporting a loss for the second quarter. 
So far today, VYNE is trading a heavy 5.3 million shares, 13 times its average daily volume of 400,000 shares.
TTD sees more on the downside for VYNE even though the stock is low priced. 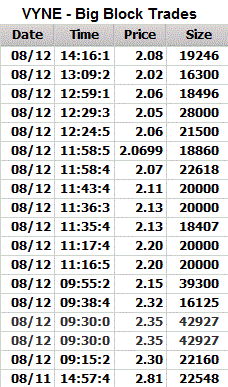
TTD highlighted VYNE as a short at our midsession video show on the Web Thursday.
VYNE's stock fell in the morning and undercut key technical support.
The stock worked lower and then touched $2.01 around noon.
It then trended mostly sideways the rest of the day unable to rally.
Tape Action
VYNE's tape action shows the recent block trades.
One can see the price for the blocks falling from $2.81 in the prior session to as low as $2.02 in the afternoon.
A key bearish trade came in the morning when a block of 22,160 shares crossed the tape at $2.30.
That was down from the prior block at $2.81 on 22,548 shares in the prior session.
Business
VYNE is developing therapies for dermatology.
The company's products include AMZEEQ minocycline. It is used to treat inflammatory lesions of moderate-to-severe acne vulgaris in adults and patients nine years of age and older.
In addition, it is also developing program for FMX114, which is a combination topical gel to treat mild-to-moderate atopic dermatitis.
The company uses its proprietary molecule stabilizing technology platform to develop its products.
Earnings:
This year, analysts predict a loss of $1.33 a share compared with a loss of $2.97 the prior year.
Going out to 2022, the Street sees a loss of 69 cents a share.
For the second quarter, analysts expect a loss of 35 cents a share compared with a loss of $4.84 the prior year.
Charts:
VYNE's daily chart shows the stock cutting below key support with expanding volume. The stock has been trending lower from 9 for several months.
VYNE's 12-month performance chart shows the stock down 60% versus a 35% gain for the stock market.
This year, insiders were buyers at $7.41 to $2.37 a share. They were sellers at $3.67 a share.
Strategy Opinion: TTD is targeting .VYNE for a decline to $1.20 within the next few months, or sooner. A protective stop buy can be placed near $2.40
Suitability: Aggressive Bears.
TTD's Stock Probability research of Prior Performance:
|
Response to Net |
Bearish |
VYNE rose 2 times after 10 earnings reports. |
|
Seasonal Success |
Bullish |
VYNE loss avg 1.8% in Aug., rose 9.3% in Sept. prior years. |
|
Earnings Beats |
Bullish |
VYNE beat Street estimate 3 times after 3 reports. |
|
TTD's Quality Rating of Stock - VYNE - BELOW AVERAGE |
Stock's Performance Chart with Quarterly Earnings Markers vs. S&P 500
Insider Buying in Green - Insider Selling in Red
TTD columnist Leo Fasciocco has covered the stock market for over 30 years. His articles appear in many publications. He has also been a speaker at the Money Show conferences. He has been on television and radio. He is author of many educational articles about stock investing and the book ōGuide To High-Performance Investing.ö

For information to subscribe to the Ticker Tape Digest Services call: Beverly Owen at 1-480-704-3331.
Distributed by Corona Publishing Enterprises. TickerTape Digest Inc. 1220 W. Sherri, Gilbert, Az. 85233.
TTD ōProfessional Reportö is available on the Web: $100 per month. Password needed. Published daily - around 20 times a month.
TTD Pro Report includes a Morning chart slide show of breakout stocks, a Midsession video-audio show with commentary on breakout stocks and shorts and a Final end of day overall report on breakout stocks for the session, short plays and accumulation plays. There are other features too such as Quick Trades and Long-term Plays.
TTD Daily Report is $39. It covers a Morning slide show of charts of stocks breaking out and a TTD end of day print report covering breakout stocks and shorts.
Credit cards accepted. Payable to Corona Publishing Enterprises.
(The information contained has been prepared from data deemed reliable but there is no guarantee of complete accuracy. Ticker Tape Digest Inc. is not affiliated with any broker, dealer or investment advisor. Nothing in this publication constitutes an offer, recommendation or solicitation to buy or sell any securities. Further research is advised. This report is copyrighted and no redistribution is permitted with out permission.)